Monitoring purposes SPX: Neutral
Monitoring purposes Gold: Gold ETF GLD long at 173.59 on 9/21/11
Long Term Trend monitor purposes: Flat

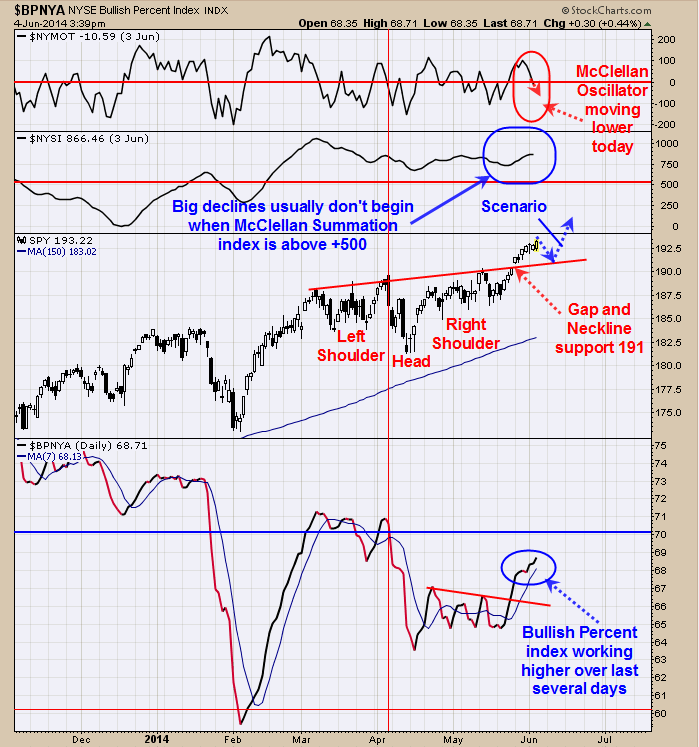
We are favoring the Head and Shoulders pattern that was discussed on last Thursday’s report. The reason why is that usually large pull backs don’t begin when the McClellan Summation index is above +500 and it stands at plus 866.46 today. The bottom window is the Bullish Percent index for the NYSE. Over the last several days the Bullish Percent index has been ticking up showing more stocks are going on a point and figure buy signals and a longer term bullish sign for the market. The top window is the McClellan Oscillator. Yesterday it closed below “0” line and continued moving lower today and will come in near -17 on today’s close. This condition suggests a short term pull back is coming. The employment situation comes this Friday and may be what the market is waiting for before it makes its next move which we are thinking will be a minor pull back to support near the 191 gap level on the SPY we have been talking about.

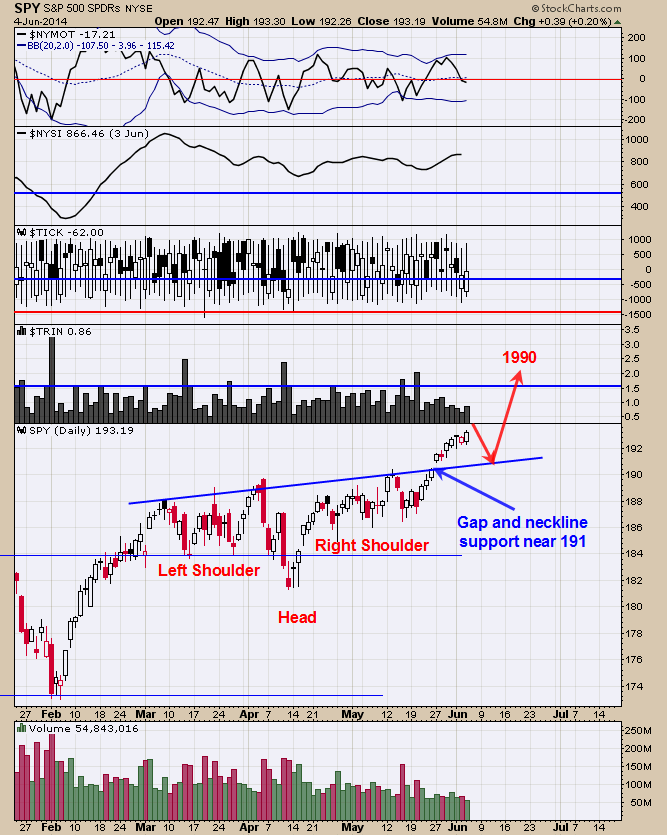
Employment numbers come out 8:30 Eastern on Friday and market could have a short term reaction. A bullish sign for the Head and Shoulders bottom theory would be for the TRIN to Close above 1.50 and ticks close below minus 300 near the Neckline and Gap area of 191 on the SPDR S&P 500 (ARCA:SPY). If that condition develops near 191 than most likely a Head and Shoulders pattern has developed and market should start to move higher from that area. If little to no panic develops in that area than the 191 would not be expected to hold and market may move lower. The gap at the 191 level may be a “mid point gap” and mark the half way point of the move, and in this case would give a target on the SPY to near 194 on this move which is close to where we are. If the Head and Shoulders pattern is the correct interpretation than this pattern has an upside target near 1990. Next week is the week before option expiration week and can produce whipsaws and option expiration week normally has a bullish bias. If the Neckline holds near 191 on the SPY we will be looking for a bullish setup late next week to early the week after. Staying neutral for now.

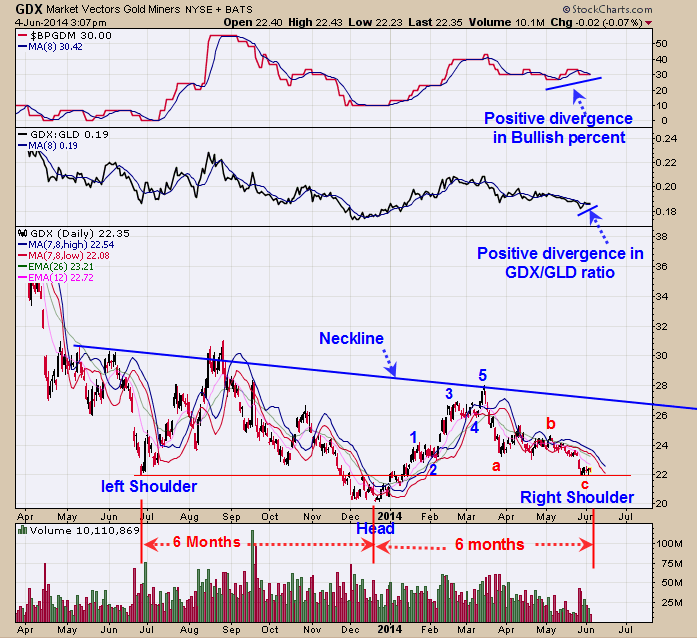
We posted a similar chart on Monday of the potential Head and Shoulders pattern above. The pattern that may be forming on Market Vectors Gold Miners (ARCA:GDX) is a Head and Shoulders bottom where the Head is the December low. The rally off of the “Head” came in five waves up which is bullish in Elliott wave terms. So far a corrective wave is coming in as an “abc” pattern (which implies consolidation phase) if it stops near current levels and attempts to rally from here. There are two bullish divergences to help support that theory which is a positive divergence in the Bullish percent index and a positive divergence in the GDX/GLD ratio. If GDX continues down from here, than the whole Head and Shoulders pattern would be in question. If GDX rallies from here to over 24 than it is likely a Head and Shoulders pattern is forming and a bull market began from the December 2013 low. There is symmetry both in time and price in a Head and Shoulders pattern. As for time, the Left Shoulder bottom formed 6 months before the Head. Adding 6 months to the Head should be close to where the Right Shoulder may form which is close to the current timeframe. With the Bullish divergence both in the Bullish Percent index and GDX/GLD ratio, a short term bottom is possible. We won’t guess what the next move will be in GDX but if it finds support near current levels and rallies near 24 or more than the picture will be come clear to what to expect and we will trade accordingly.
