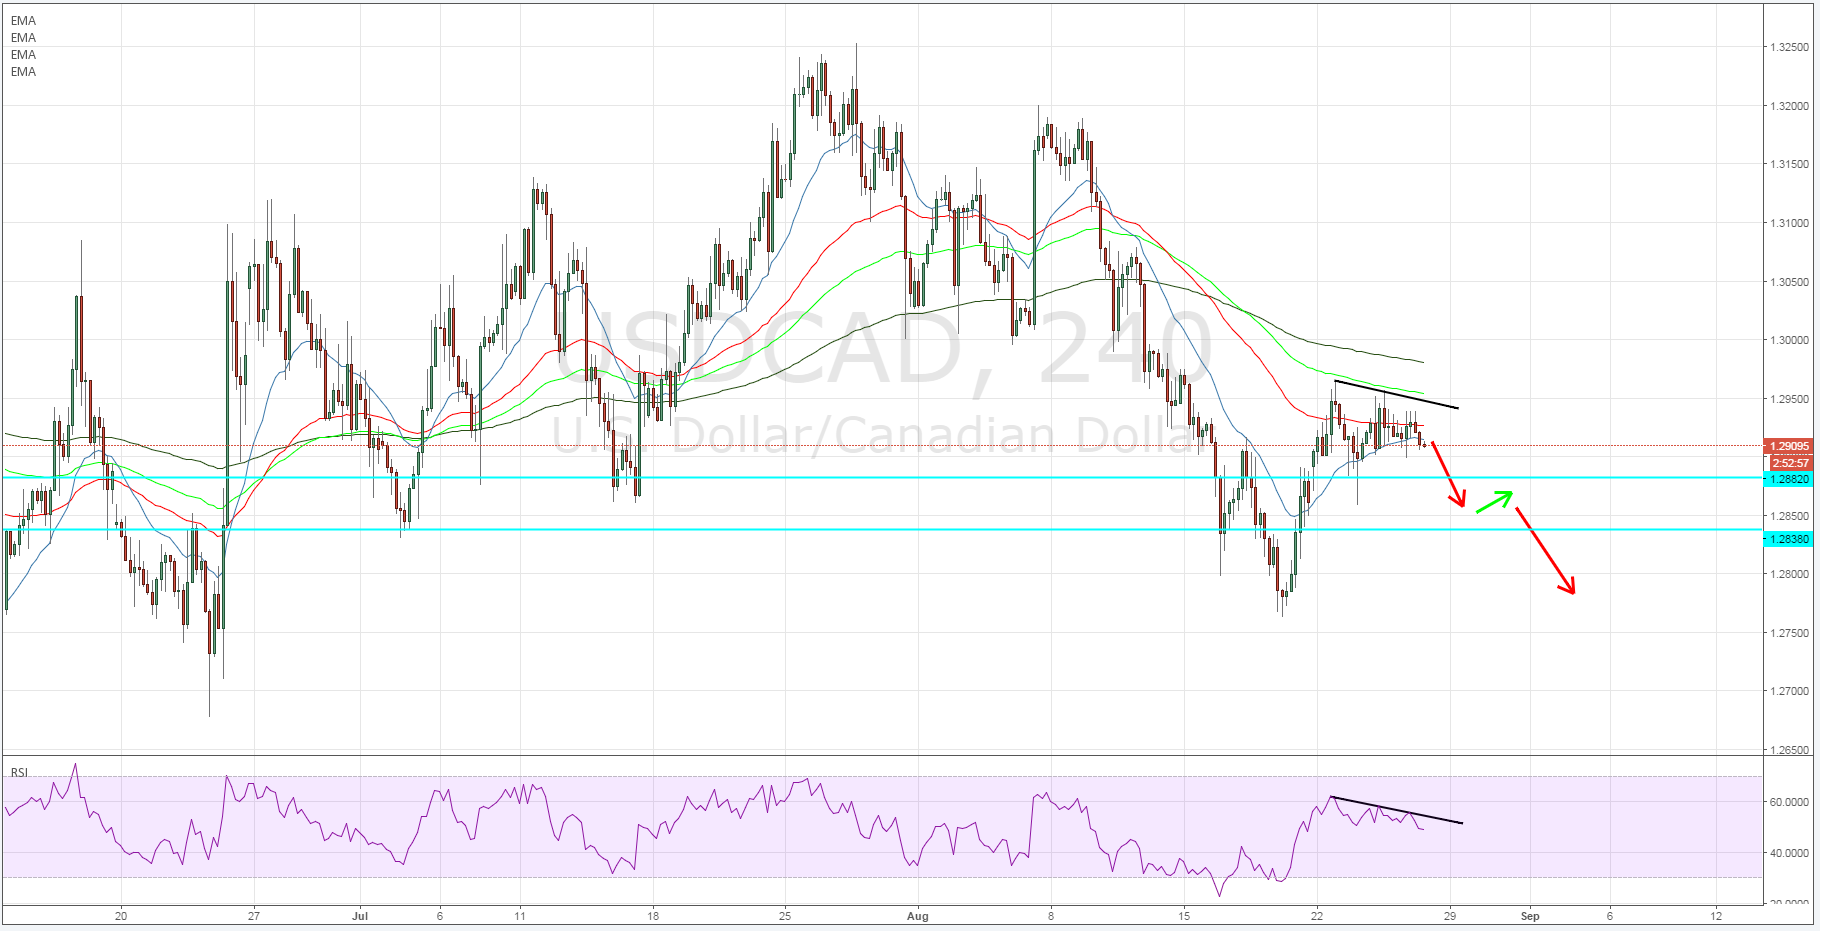
Key Points:
- 100-Day MA acting as dynamic resistance.
- RSI Oscillator trending lower.
- Price action signals simple bearish breakdown likely.
There is always a risk with technical analysis that you can over complicate a specific trade with the use of too many indicators. However, the USD/CAD is currently demonstrating a simple yet interesting bearish pattern that is likely to bring about a break to the downside in the days ahead.
The loonie has been largely range bound since the middle of April when crude oil prices largely stabilised. However, the past few weeks has seen the embattled pair trending strongly towards the bottom constraint of the channel, forming a new monthly low at 1.2762, before staging a small retracement back towards the 100 Day MA.
Consequently, the 100 MA is now acting as dynamic resistance and has capped any upside gains over the past week. Additionally, price action is now largely meandering sideways whilst the highs become lower and the falling 100MA increases the downside pressure.
Also, the RSI Oscillator is slowly trending lower, within neutral territory, indicating that there is plenty of room to move on the downside.

Fundamentally, there are also plenty of reasons to expect a bearish fall for the pair in the coming week given that the Fed is deeply entrenched currently in the annual Jackson Hole symposium on monetary policy.
These events always provide plenty of enlightening commentary and this year is likely to be no exception with Fed Chair Yellen due to speak late on Friday.
Subsequently, given the risk of further rate hike delays and increasingly dovish rhetoric, a sharp dollar depreciation is a likely possibility and further supports the downside contention.
Ultimately, given the slowly falling moving averages we are likely to see a further downside breakdown for the USD/CAD in the coming days. Any such move would need to surmount the daily support level at 1.2882 before commencing a slow drift towards the 1.2838 target level and the monthly low in extension.
