A few weeks ago we took a long-term view at GBP/NZD, concluding that the big rally in the pair could stretch further after the big breakout above 2.10 resistance. Since that report was published, GBP/NZD has tacked on another 800+ pips to test 2.30 as we go to press, and while more upside is definitely possible on GBP/NZD, it may make more sense to play the theme of further kiwi weakness through NZD/USD.
The recent price action in the New Zealand dollar provides a perfect example of how a rapid shift in monetary policy expectations can lead to a massive move in the FX market. Over a period of just two months, the RBNZ has shifted from a tightening bias on monetary policy to outright easing, with traders pricing in another one or two interest rate cuts this year in addition to the one we saw two weeks ago. NZD/USD has been absolutely walloped as a result, with the pair falling nearly 1,000 pips, or nearly 13%, over the last two months alone.
Unfortunately for kiwi bulls, it may be awhile longer before NZD/USD can stem its bleeding. Last week’s abysmal New Zealand Q1 GDP reading already has some analysts calling for another 25bps interest rate cut at the RBNZ’s meeting next month, while the US Federal Reserve seems to have its heart set on hiking interest rates at least once (and maybe even twice if the Fed’s “dot chart” is to be believed) later this year.
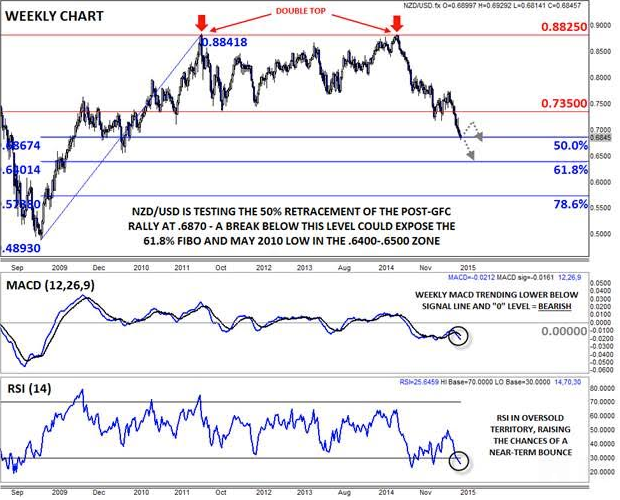
On a technical basis, NZD/USD is on the verge of a major long-term breakdown below the 50% retracement of the entire post-GFC rally from below .5000 to nearly .9000 at .6870. Bolstering the bearish case, the weekly MACD indicator has rolled over and is now trending lower below both its signal line and the “0” level, though the oversold reading on the weekly RSI could lead to a short-term bounce.
Taking a step back, the most recent drop comes on the back of a massive, multi-year double top pattern at the .8825 level; if this pattern reaches maturity, it would suggest a measured move objective all the way down below .6000! More immediately, a weekly close below the 50% retracement at .6870 would open the door for another leg down toward the May 2010 low near .6500 or the 61.8% Fibonacci retracement around .6400 as we head into Q3.

Source: FOREX.com
For more intraday analysis and market updates, follow us on twitter (@MWellerFX and @FOREXcom)
