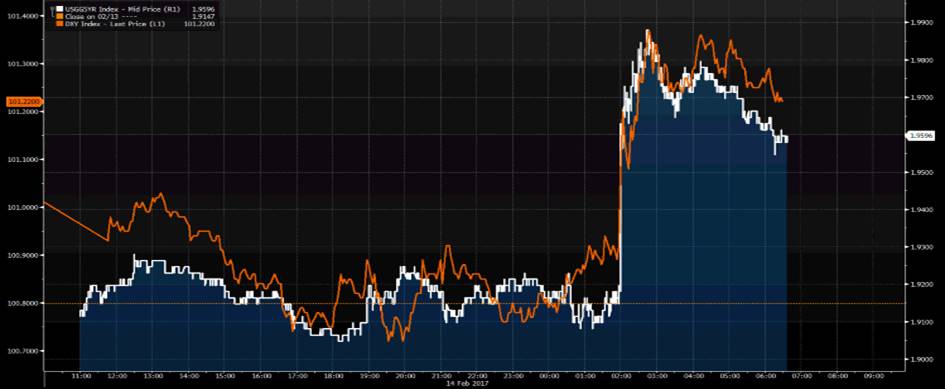
We were almost presented with a sell signal on the ASX 200, but the reassurance we have from a modestly stronger U.S. trading session should see the Aussie market open on the front foot.
Whether that good will lasts is yet to be seen and we may end up having a re-run of yesterday’s tape, where the index opened on a high and tailed off quickly. 15 ASX companies report today, with CSL and CBA the two names that traders will centre on. The numbers from CBA look good on first blush, with 1H cash earnings above the street at $4.91 billion, an interim dividend of $1.99 and net interest margins at 2.11%. Return on equity sits at 16%, with CET1 capital ratio (APRA) at 9.9%, both above the street. So while there is much to focus in the numbers (including bad and doubtful debts), but they should be well received as will the commentary about the Australian economy.
We have seen a touch of buying in SPI futures, which indicates some support on open.
Any disappointment and CBA may test $81.00 level, where the buyers have supported on at least five times since 20 January.
For the traders among us, U.S. banks look a better short-term play, with a lovely break-out through the recent range in KBE ETF (SPDR S&P Bank (MX:KBE) ETF). Preferably one would like a slight pullback and a wave of new buying to come in to confirm the technical break, but this ETF is trending like a dream and longs are preferred with a tight stop through $44.00. Fundamentally, the US banks are simply being used as a vehicle to express reflation and “Trumponomics”. Although last night really belonged to Janet Yellen whose prepared comments to the Senate Banking Committee that waiting too long to tighten would be “unwise” and a further review its policy stance (which she detailed as “accommodative”) will take place at its upcoming meetings.

The market reacted instantly to her optimistic remarks or at least the algo’s did, with the U.S. five-year treasury spiking 8bp off the bat, taking the USD with it. The USD index is now up for 10 consecutive days, but we haven’t seen a day where the gains have been more than 0.4% in that run – such is the implied volatility. The wash-up of the chair's comments have been a slight tweak in the implied probability of a March hike, which now sits at 17.7% (source: CMEgroup). While there is no April FOMC meeting, if we use the April fed funds future (which has the most open interest) we can see 60bp of tightening priced over the coming 12 months. Therefore the markets are starting to warm to the idea that we could be looking at three hikes over the coming 12 months. It’s no wonder USD/JPY has pushed up above ¥114.00 again.

Watch U.S. retail sales (due out at 00:30 aedt) with consensus expecting the control group (the element of retail sales that feeds directly into the GDP calculation) to increase 0.4%. There once was a time when retail sales were one of the most important US data points and I suspect that could become a theme going forward if Trump genuinely can engineer true ‘animal spirits’. We can look at business investment, but the feel good factor needs to translate into retail spending and that may come.
One aspect we should also keep an eye on is the Chinese money markets, as there is a growing view that the China 7-day ‘repo’ has become the key policy tool for the PBoC. Yesterday’s we saw this instrument push up a further 25bp to 3.25% and while it is not at concerning levels, given the amazing inflationary trends we saw yesterday, with PPI testing the 7% level and once again easily beating expectations. The worry is if inflation keeps pushing higher we may see a far more intense tightening of monetary conditions. Setting monetary policy is a balancing act in the Chinese economy, so the last thing the PBoC need now are continued strong inflationary pressures that could become more of a headwind to growth. One to watch, but there is a new focus on China’s short-term money market to garner a sense of liquidity and thus a tolerance for lower growth in a bid to promote greater financial stability.
The AUD/USD was buoyed yesterday by the undeniably strong NAB business conditions and confidence. I felt the prospect of this data point having a material influence on the AUD was minimal, but then few expected a read that was far more thematic with an economy that needs tighter monetary policy. AUD/USD has traded in a range of $0.7696 to $0.7618, but for AUD traders the better trade (in my opinion) continues to be short EUR/AUD and long AUD/JPY. AUD/JPY needs a break of the 15 December high of ¥87.53 and then it’s on, so again this pair is on the radar.
In the commodities space, U.S. crude has pushed up 0.7% and all eyes fall on the Department of Energy inventory report (due out at 02:30), with expectations of a strong build in both crude (consensus of 3.491 million barrels) and gasoline (1.699 million barrels). Modest falls have been seen in iron ore -0.6%, iron ore futures -1.3%, steel futures -0.3% and coking coal futures -2.3%. Copper has dropped 1.3%.
