It's been a turbulent session, but that’s not to say risk cannot pick itself back up from here. If Trump allows.
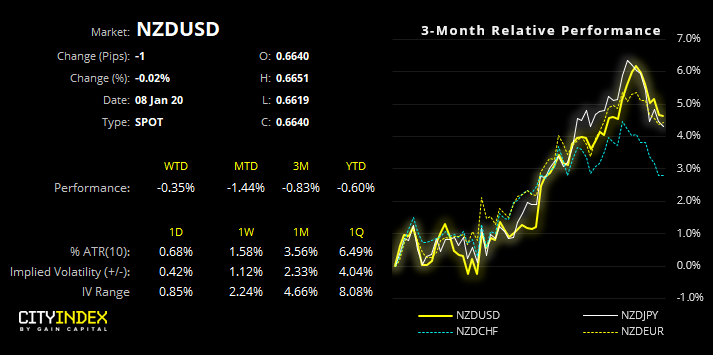
It was clearly a game of two halves for traders, with risk-off dominating the first half upon news of Iran attacking US bases in Iraq. Yet fears subsided and markets reversed course when it was confirmed the US suffered no casualties and that President Trump didn’t appear to want to retaliate.
He’s due to provide an official statement “tomorrow morning” (Wednesday AM US) which is not the wording one would expect from someone ready to act. So, for now at least, markets are able to catch their breath and regroup.
Assuming tensions don’t escalate once more, markets may be able to focus on fundamentals and shy away from geopolitical drivers. If so, it could allow us to revert to our core view on bullish NZD, which has clearly taken a hit and allowed it to undergo a much-needed retracement.
Please note, the purpose here is to assess the potential for NZD pairs to form swing lows. Given the sensitivity to Middle East headlines, allow for volatility around current levels. Furthermore, we’d likely need to see sentiment swing back to clear risk-on to help such pairs bounce accordingly.
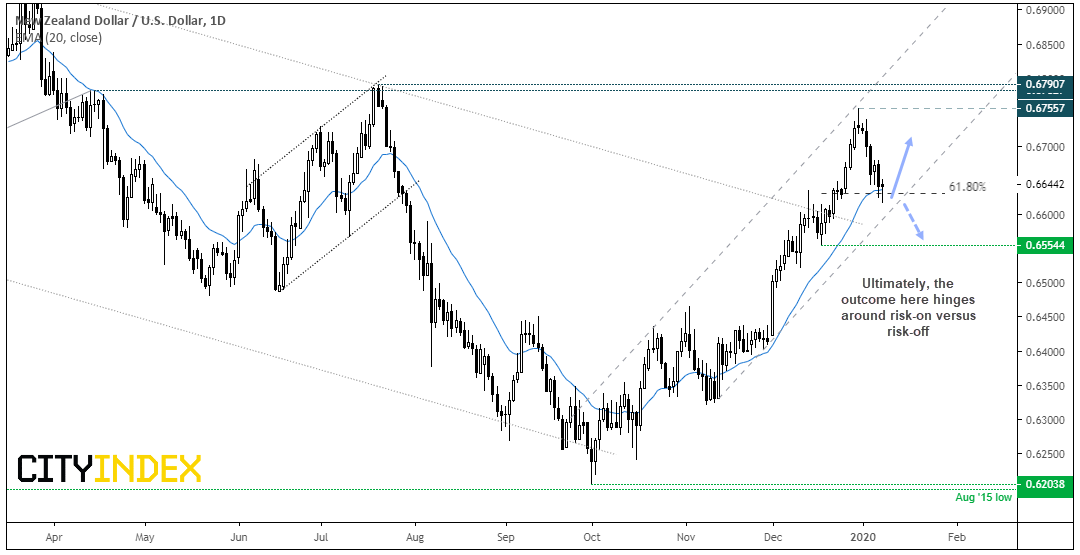
NZD/USD: The Kiwi remains within its bullish channel and is trying to find support above the 20-day eMA. Around current levels, its on track for a bullish hammer on the daily chart, although we still have the European and US sessions ahead of us. Still, with such a strong trend structure, NZD/USD is a suitable candidate for ‘dip’ traders, so we’ll continue to monitor its potential for a swing low to form and momentum realign with its bullish trend.
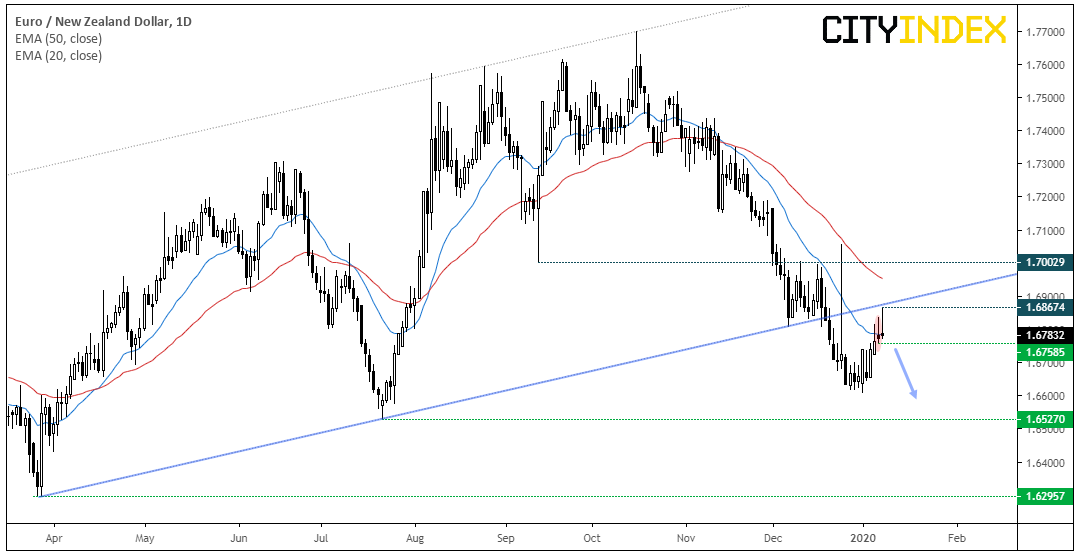
EUR/NZD: Having retraced from its January low, we’re looking for evidence of a swing high. With yesterday’s bearish pinbar, the near-bearish hammer the prior session and today’s sharp reversal, the case for a swing high is building. Furthermore, price action is respecting the lower trendline of the broken channel. Whilst the trendline holds, traders could take a break of the pinbar low (1.6758) that the bears are back in control. Given the yield differential between RBNZ and ECB base rates, this currency provides a positive carry.
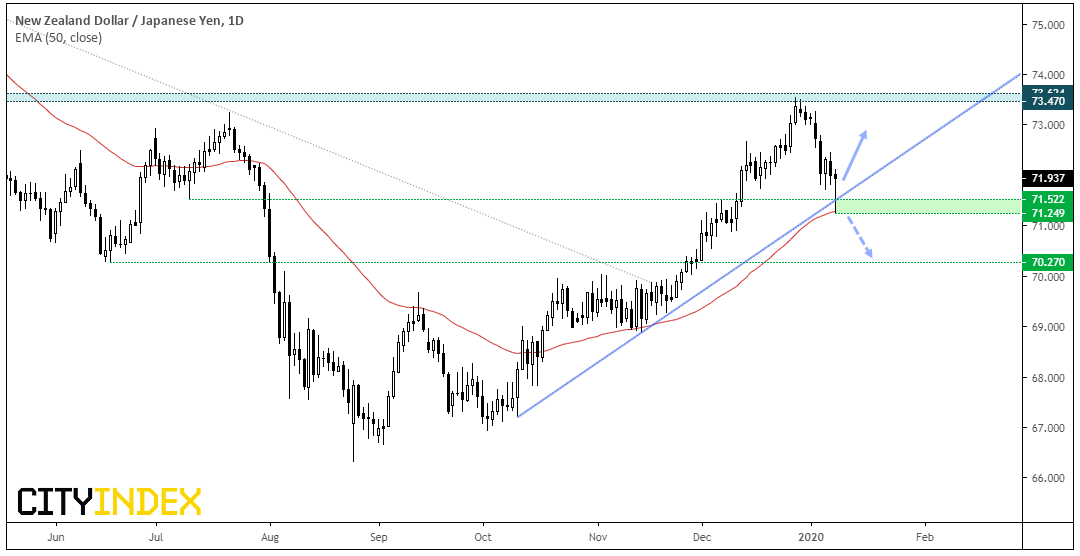
NZD/JPY: Another kiwi cross at a key level. We’ve seen an intraday break of the October trendline but it did find support at the 50-day eMA. A bullish pinbar close would be encouraging, as would a rally in the US session if Trump’s statement isn’t too warmongering.
Usually we’d expect AUD/JPY to be ‘the’ go to FX barometer of risk but due to their wildfires and expectations of an RBA cut in February, NZD/JPY takes its place. Therefor a rise in Middle East tensions could send this sharply lower, or higher if they fail to materialise (in line with our core bullish view).
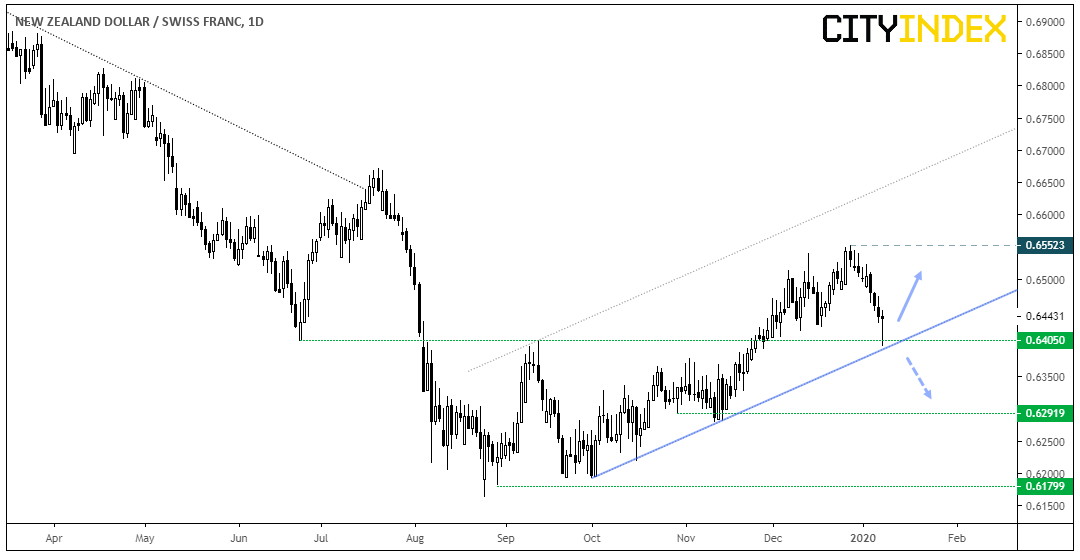
NZD/CHF: The trend structure is not as strong compared with NZD/USD, but it does trade within a bullish channel. We also like how today’s low respected both the lower trendline and 0.6405 support before reversing (0.6400 is a pivotal level going forward). It also provides a positive carry, so if you’re bullish on NZD for the ‘long’ haul, it could be suitable for a longer hold time.
