We follow precious metals, not as harbingers of financial armageddon or even geopolitical unrest, but primarily as a leading proxy of the commodity markets - that we feel provides the most nuanced view of which way the inflation vane is pointing today and possibly headed tomorrow.
There is an ambiguity associated with precious metals relative value and causative motivations, that extends in part from their archaic beginnings - to legacy as the cornerstone in the previous monetary system. Because of this history, the sector has maintained a large congregation of fervent believers, that see gold and silver as the ultimate currency and backstop of fiscal and monetary responsibility. As a result of this heightened market psychology, they tend to be the most sensitive to expectations and can lead broader moves in the commodity sector and inflation expectations downstream.
Back in the spring of 2011, we viewed precious metals - specifically silver, as testament to the exceedingly frothy and misguided expectations that many participants associated with inflation at that time (see Here). Where a one-way street for commodities and the dollar was assumed, we saw a dangerously lopsided market with all the hallmarks of exhaustion and absent of any real evidence, that the structural transmission mechanism of QE merited the rise in inflation expectations, that many participants held and/or feared.
Generally speaking, we maintained this perspective as the downside pivots in precious metals and commodities unfolded, and incorporated a market posture around the thesis until late in the second quarter of last year. At that time, we felt that market conditions in the US dollar and yields had shifted and were no longer favorably behind the great unwind in metals and commodities. Moreover, sentiment had strongly capitulated, positioning was at bearish extremes and market structure was presenting clear signatures of downside exhaustion - e.g. waterfall declines.
Since then, the sector has rallied and receded three times over, most recently pressured lower by an exceptional move in the US dollar - the likes of which (11 week consecutive rally) have not been seen since the dollar was floated by Nixon in August of 1971. In hindsight, our expectations in precious metals, commodities and ultimately inflation - have been off the mark (i.e. wrong), predominantly because we initially assumed the respective trends would pivot swiftly out of their respective lows from last year. Forever the humbler of mice and men, market conditions have pandered to both sides of the field - the bulls most recently, and have rewarded mercenary traders with healthy swings to exploit, as the respective moves in both yields and currencies have worked to define the range.
So with the sector once again in tatters and circling the drain from last year's lows, does the recent breakdown in metals mark the start of another leg lower for commodities and inflation - or just another interim low in what has become an ever broadening range?
Like all speculative moves, they either eventually find some fundamental traction or exhaust when an external catalyst exposes that sentiment, positioning and the underlying market psychology had become dangerously lopsided and out of tune. This was the case in 2011 when a weak dollar was a foregone conclusion and inflation expectations had reached a fever pitch. Seemingly out of left field, the death of Osama bin Laden pricked the speculative run in silver (see Here), which also marketed the top for the broader commodity sector.
Inflation expectations - just like asset prices, can rise and fall with strong reflexive feedback tendencies. Look no further than the recent past to see where the currency markets have magnified the moves in the commodity markets and inflation expectations around the world. With hindsight 20/20, from a fundamental perspective did it make much sense that inflation expectations surged as the financial crisis began? With global demand cratering - did the market fundamentally merit $140/barrel oil? One could make the argument that reflexivity greatly impacts trends at the trough of the cycle, where the velocity of money declines and where speculation can have a disproportionate influence on fundamental expectations. That being said, it can cut both ways - which once could argue has contributed recently to magnifying the moves in the currency markets, the downturn in commodities - as well as inflation expectations. Considering the US is poised to end what we perceive became disinflationary policy and where the balance of the world's largest central banks look to stimulate their own economies and inflation expectations, does a continuation of the broader disinflationary trend that began in 2011 on the back of the US dollar hold much water today?
We don't believe so and find similar market conditions in both sentiment and positioning, that were present at the June 2013 lows in precious metals and which are inverse to the underlying market psychology that was present at the top of the cycle in 2011. Moreover, with commercial short positions in the US dollar the largest on record and with bullish speculative sentiment pined at the top of the range, the tinder doesn't get much drier should a match get thrown. The same could be said on the opposite side of the exchange for our commodity proxies in gold and silver as well as the euro. From an anecdotal perspective, you also find parallel despondency towards gold that was present last June from both producers and pundits alike.
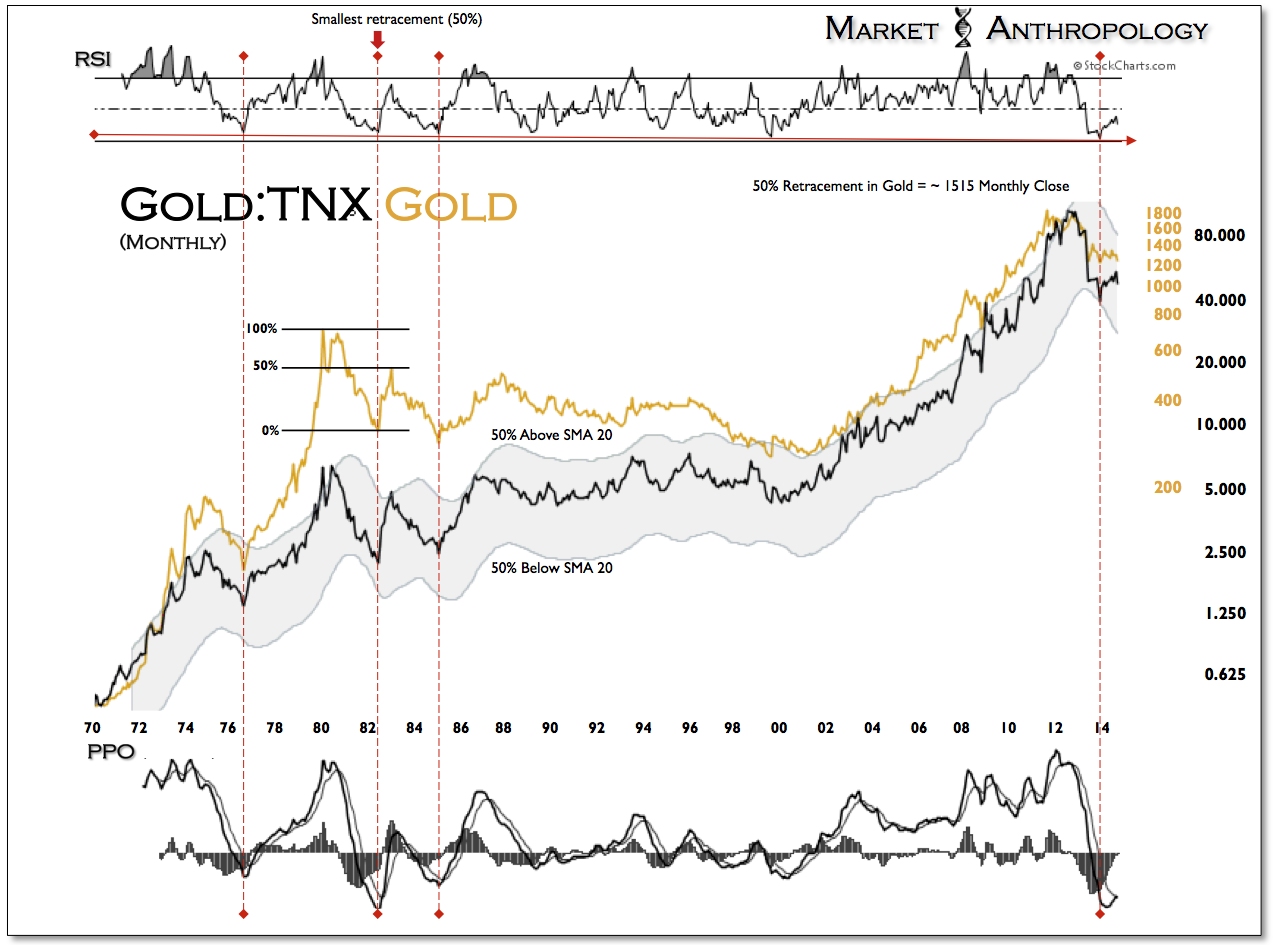
From a basic technical perspective, the damage ended last week for both gold and silver around trend line support that extends from November 2001 in gold and March 2003 for silver.
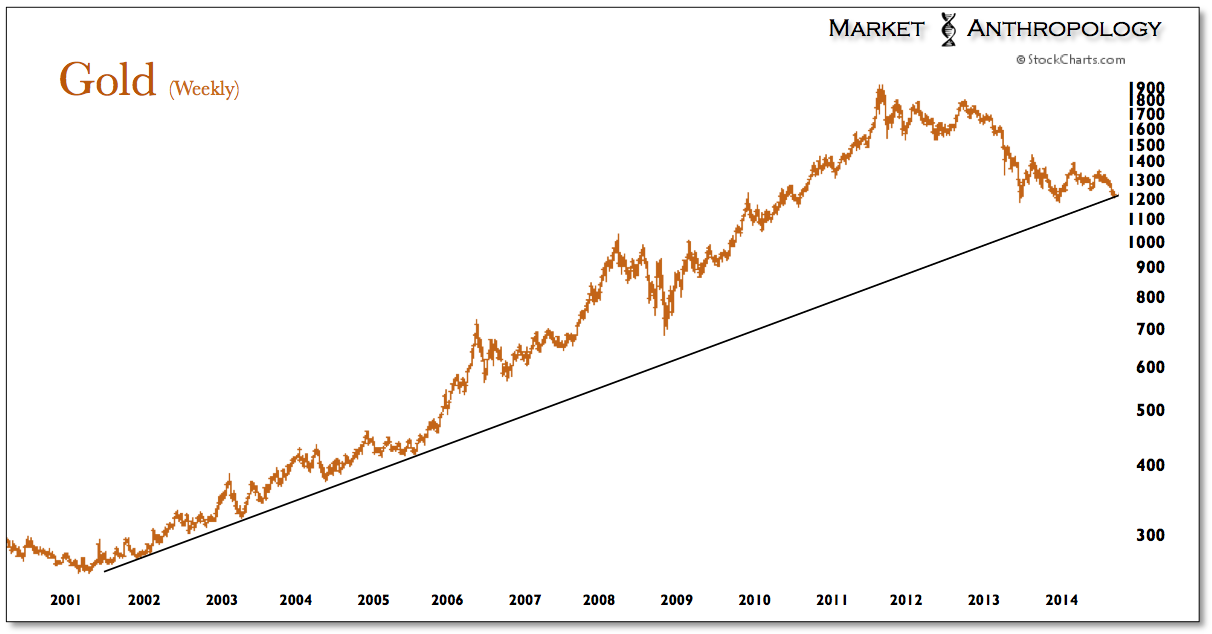
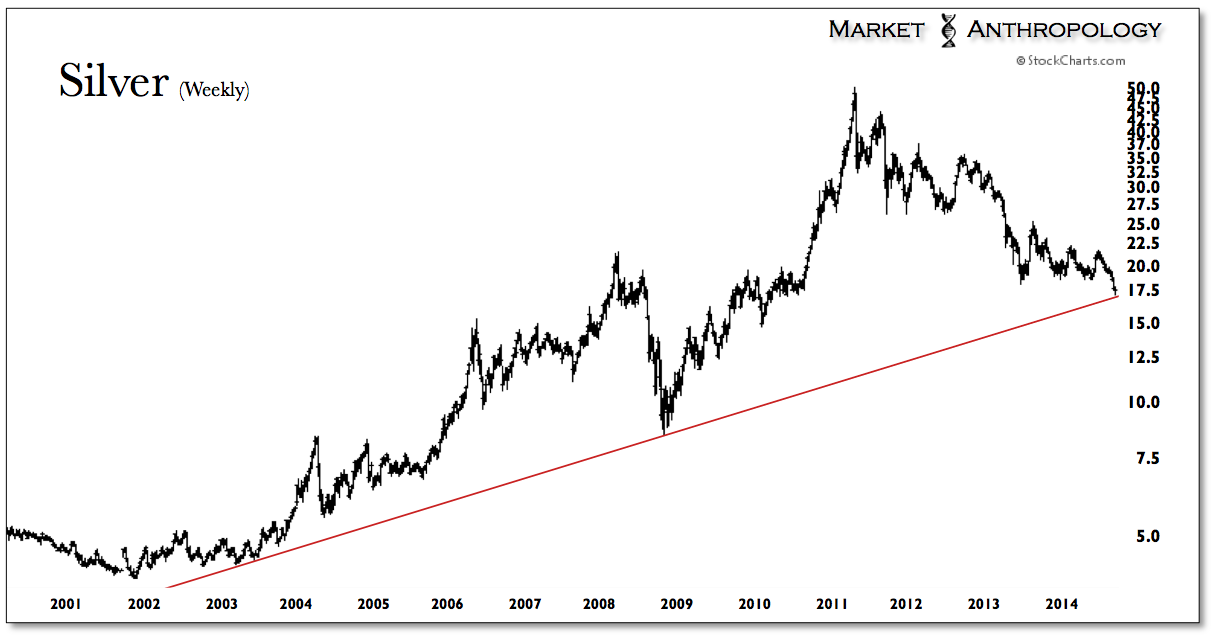
Considering current market extremes in both sentiment and positioning, the impetus for a further breakdown below support would likely prove ephemeral. Moreover, momentum is still expressing a positive divergence on both a weekly and monthly time frame in both metals.
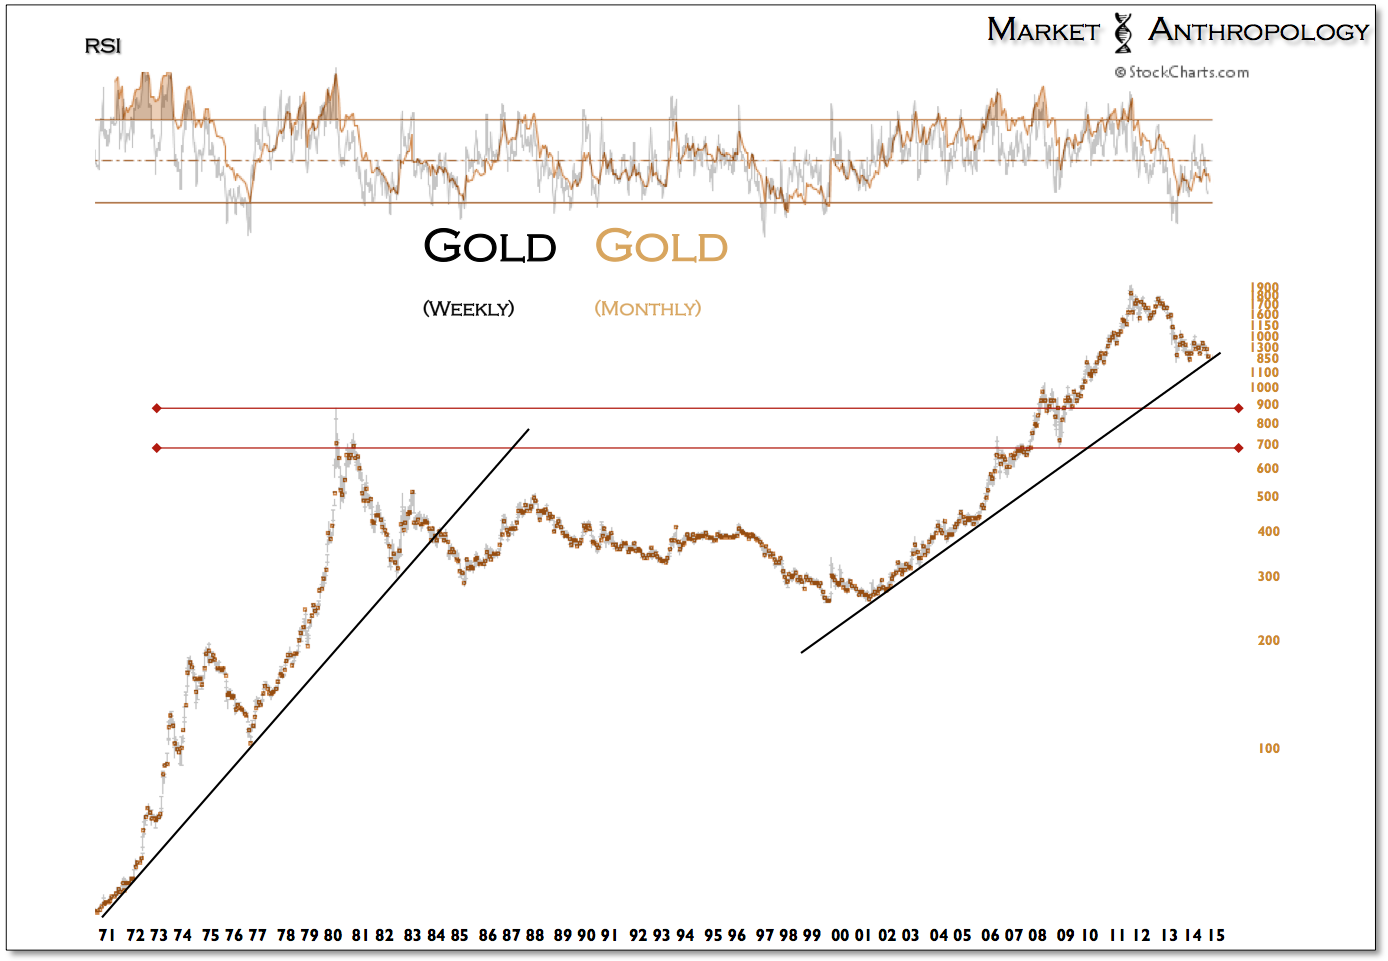
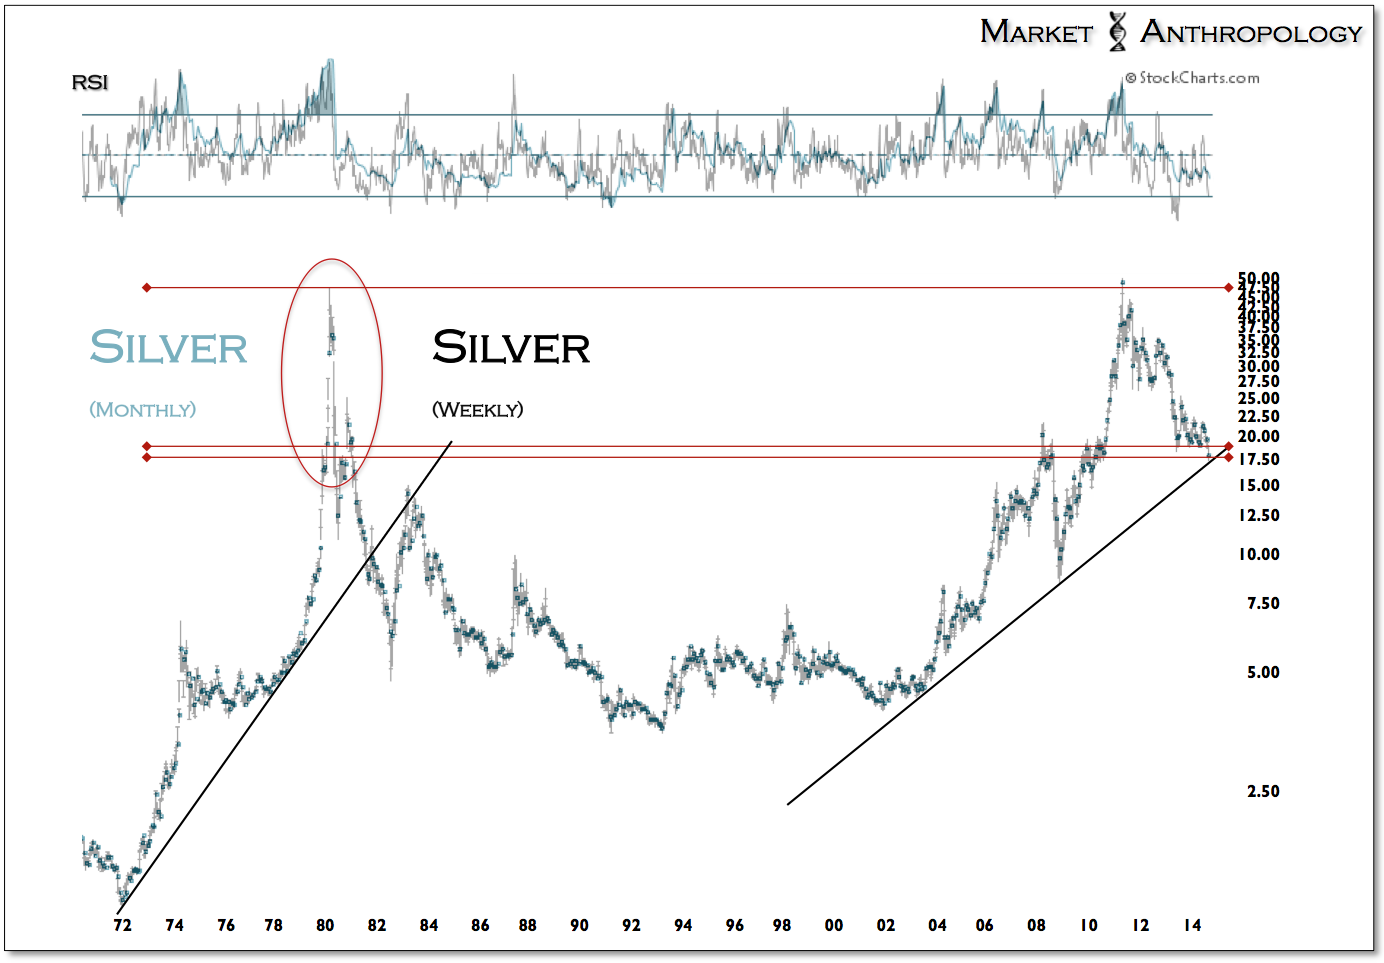
Over the past two weeks silver broke down below last year's daily and weekly low and found support between the exhaustion gap of the 1980 blow-off top and trend line support extending from 2003. Similar to the weekly low registered in the first week of July (2013) where managed money started covering their expansive short positions, current shorts began covering last week - approximately 50% larger than what at the time was a historic extreme last year.
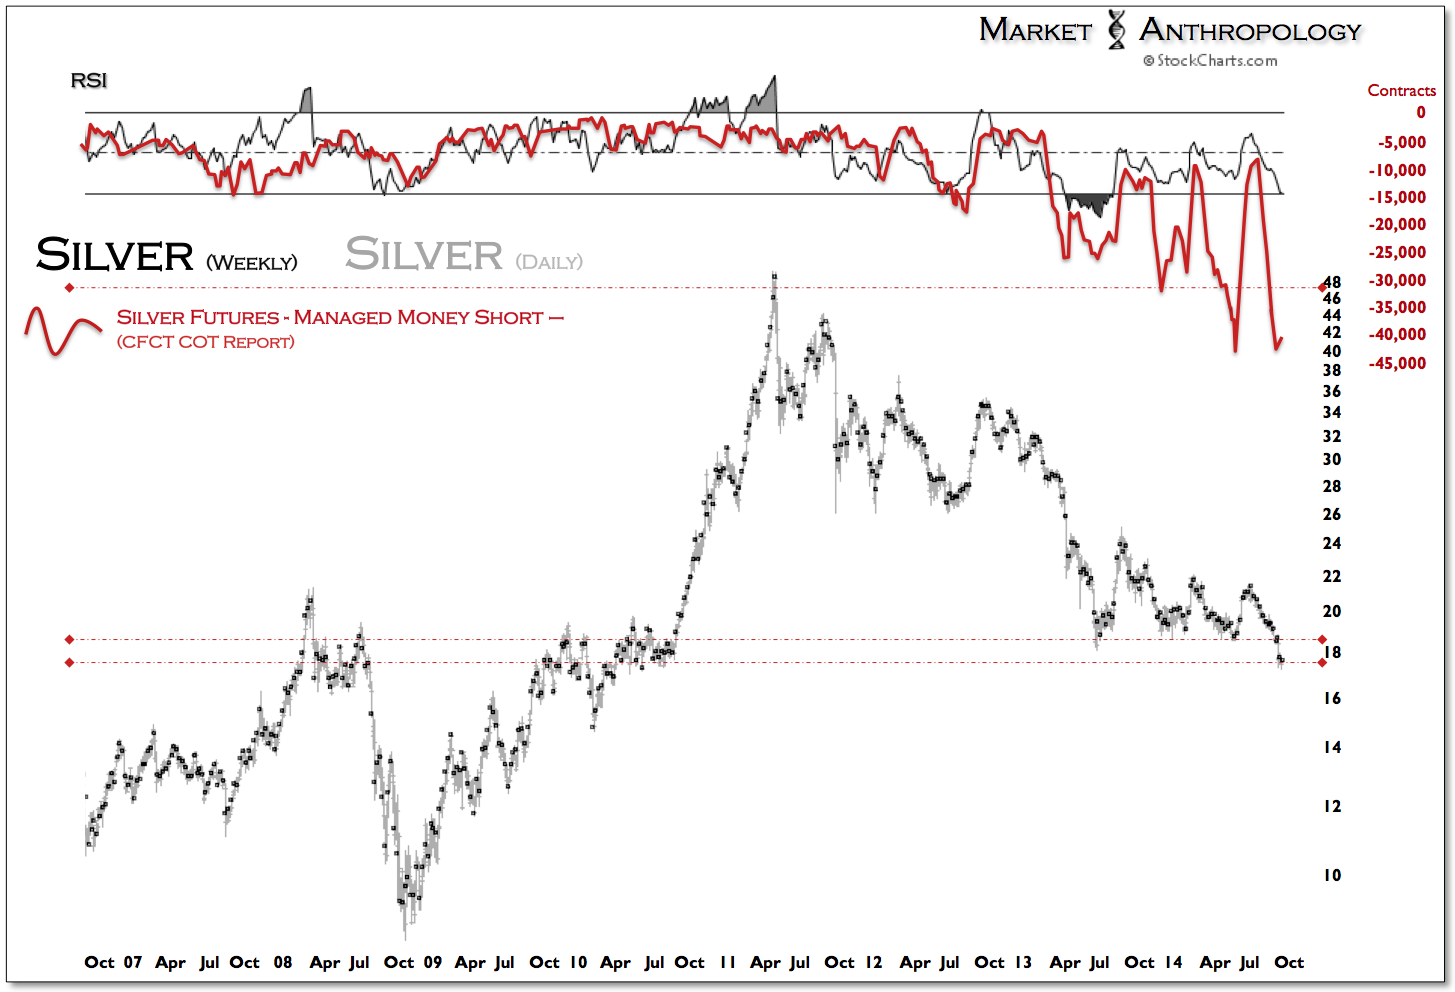
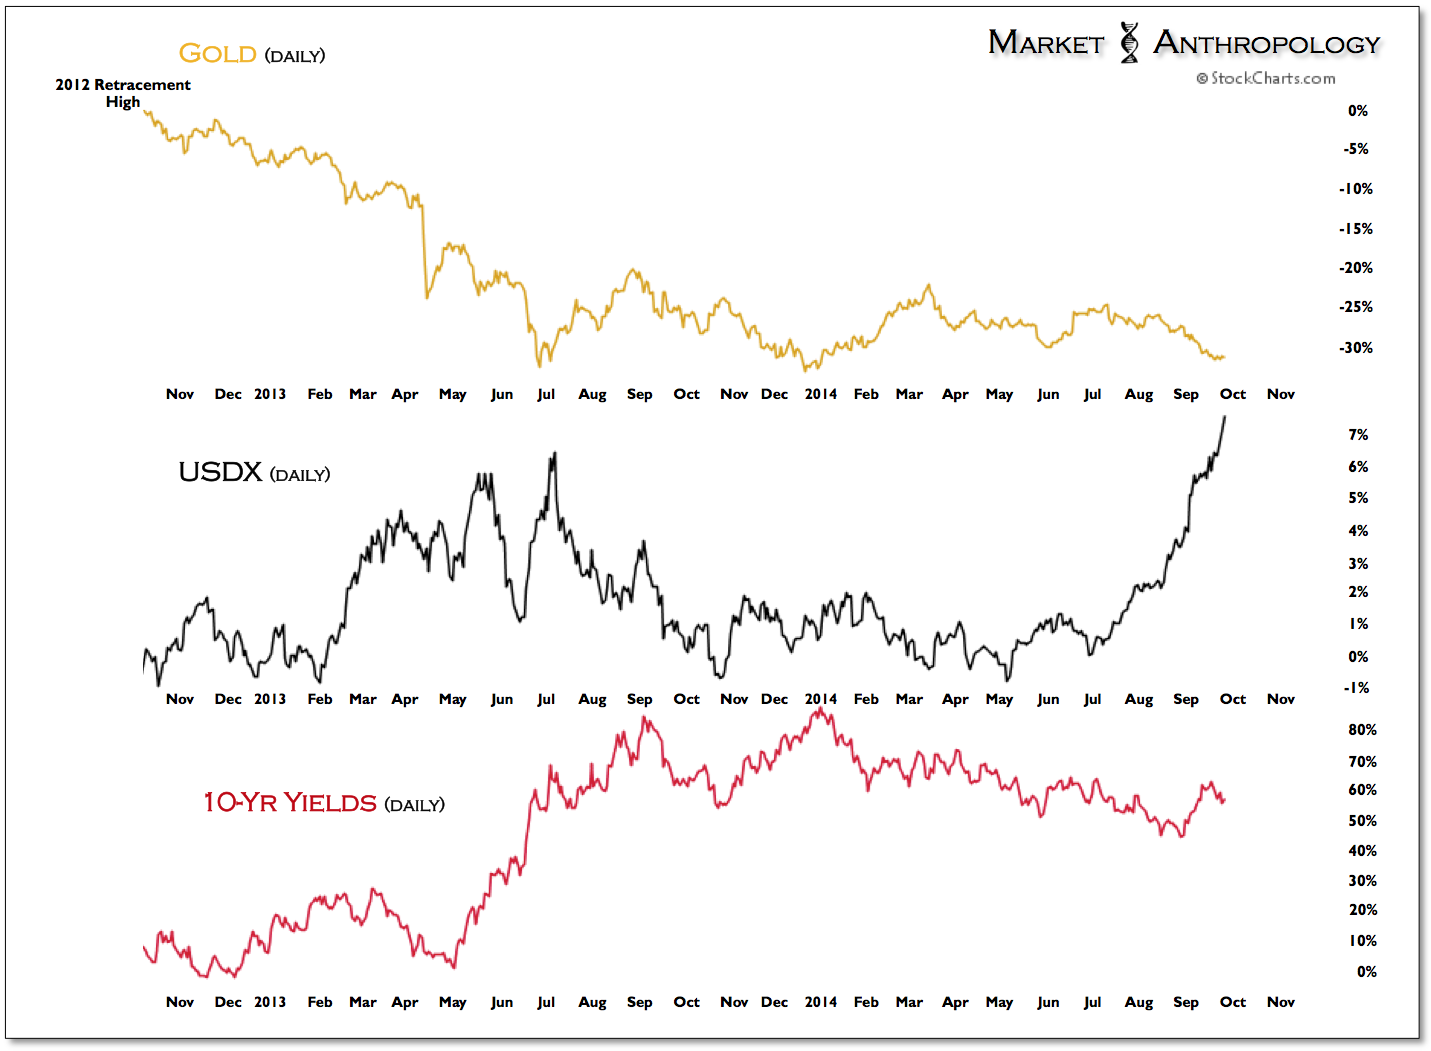
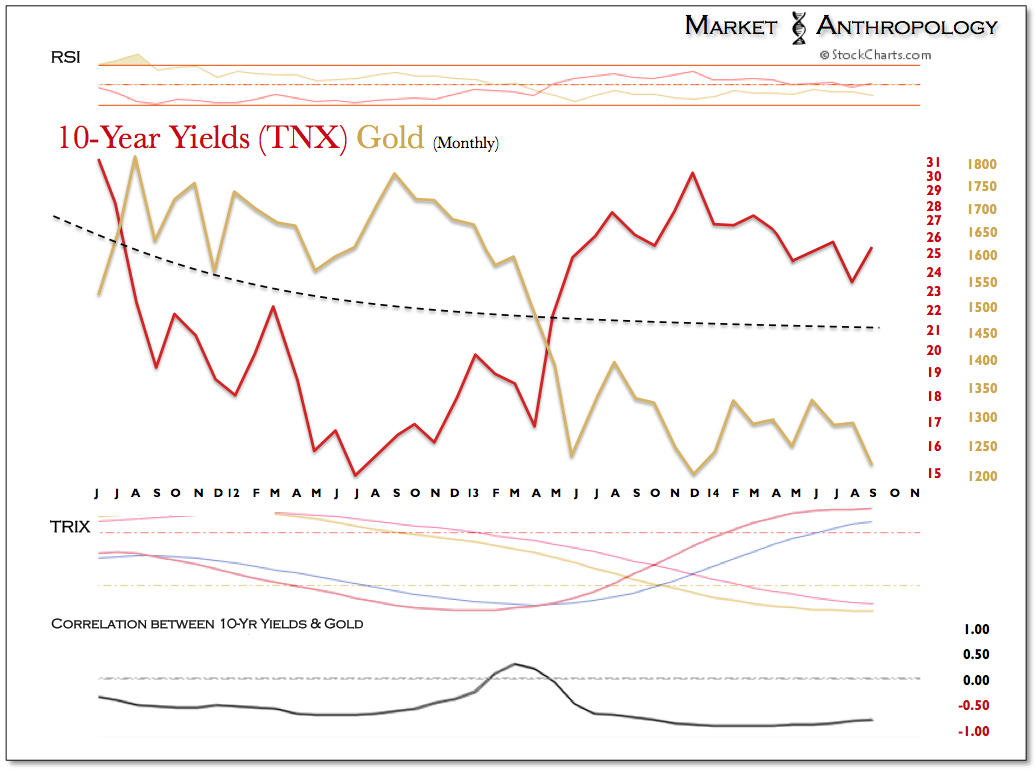
From a qualitative perspective, both metals have weathered the explosive US dollar rally comparatively well. Unlike conditions in the first half of last year where both yields and the dollar worked in tandem against the sector, yields have stair stepped lower since May while the dollar became the outlier influence.
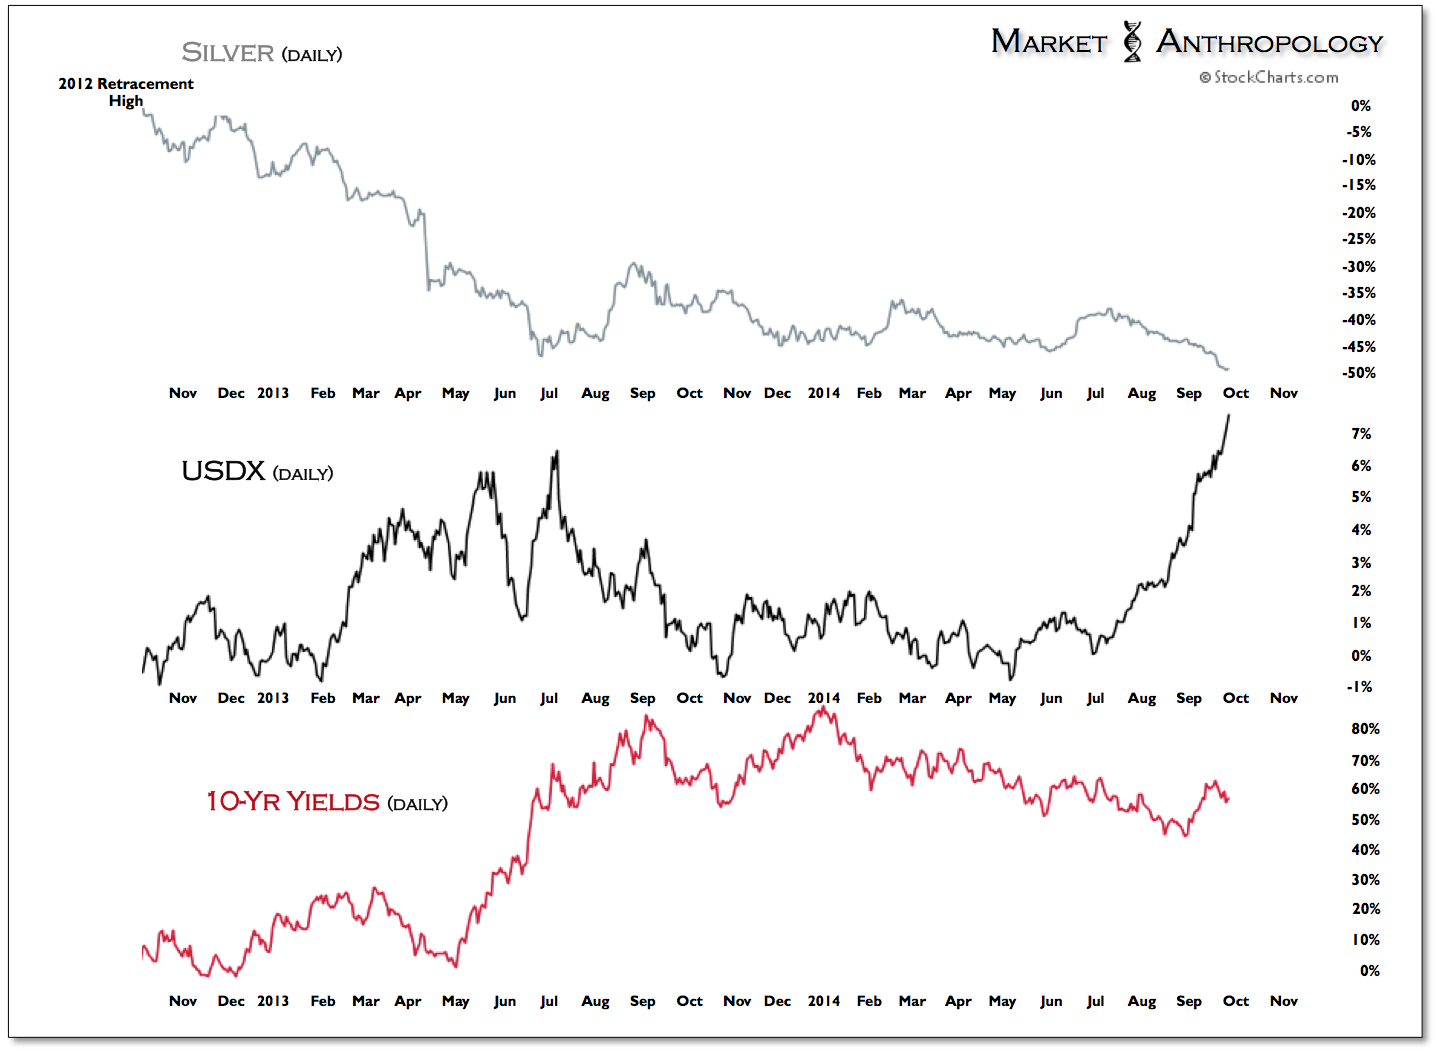
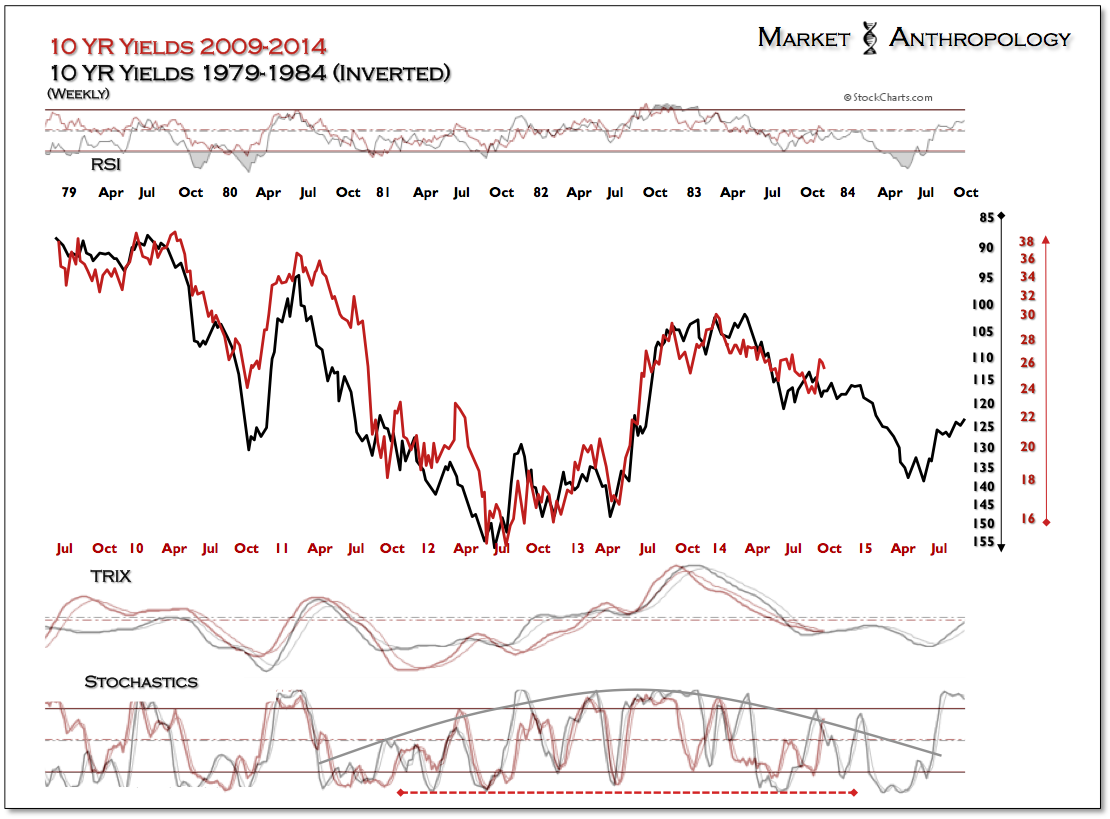
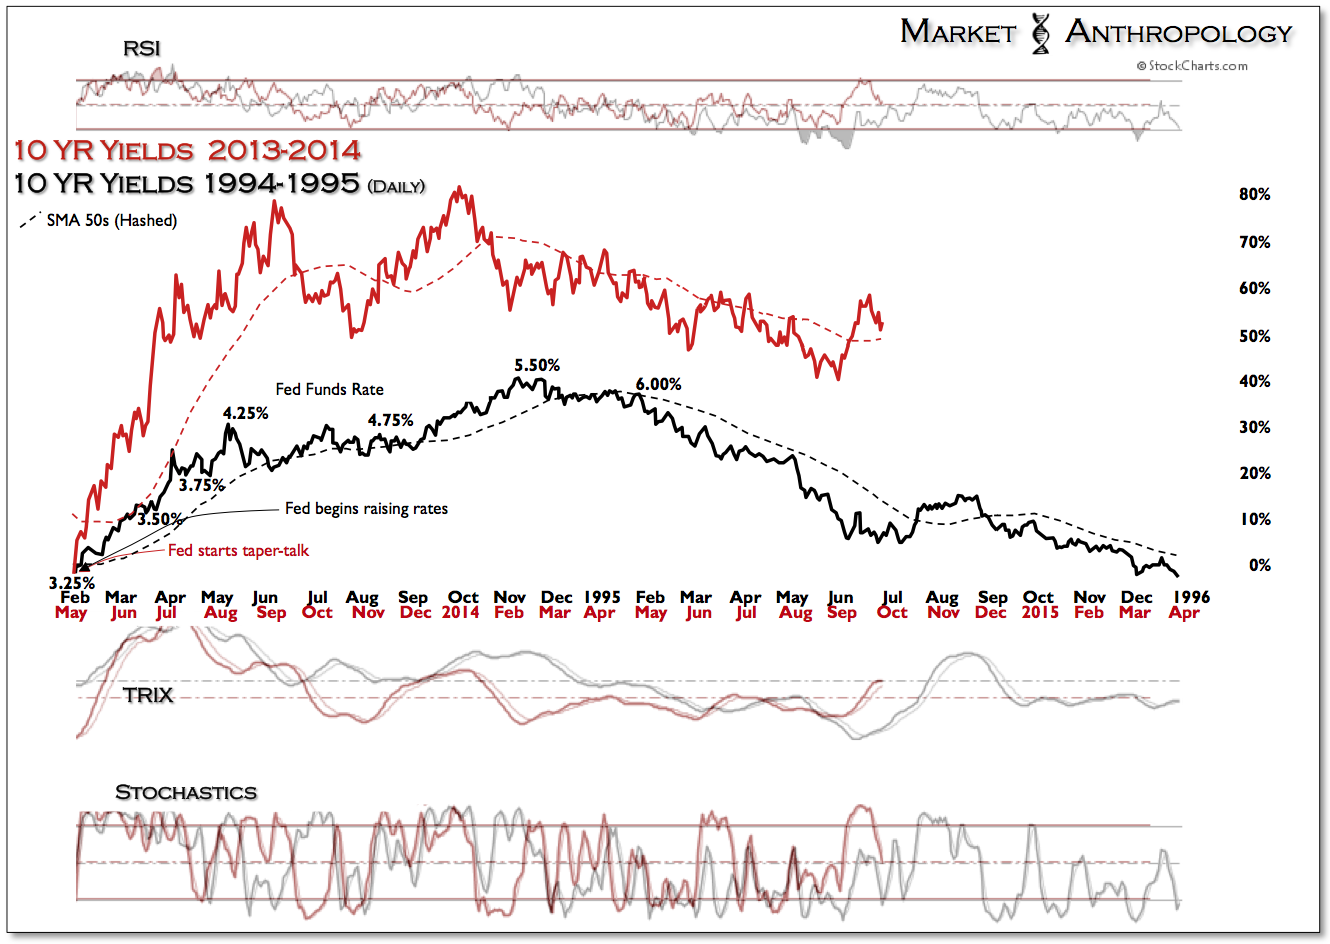
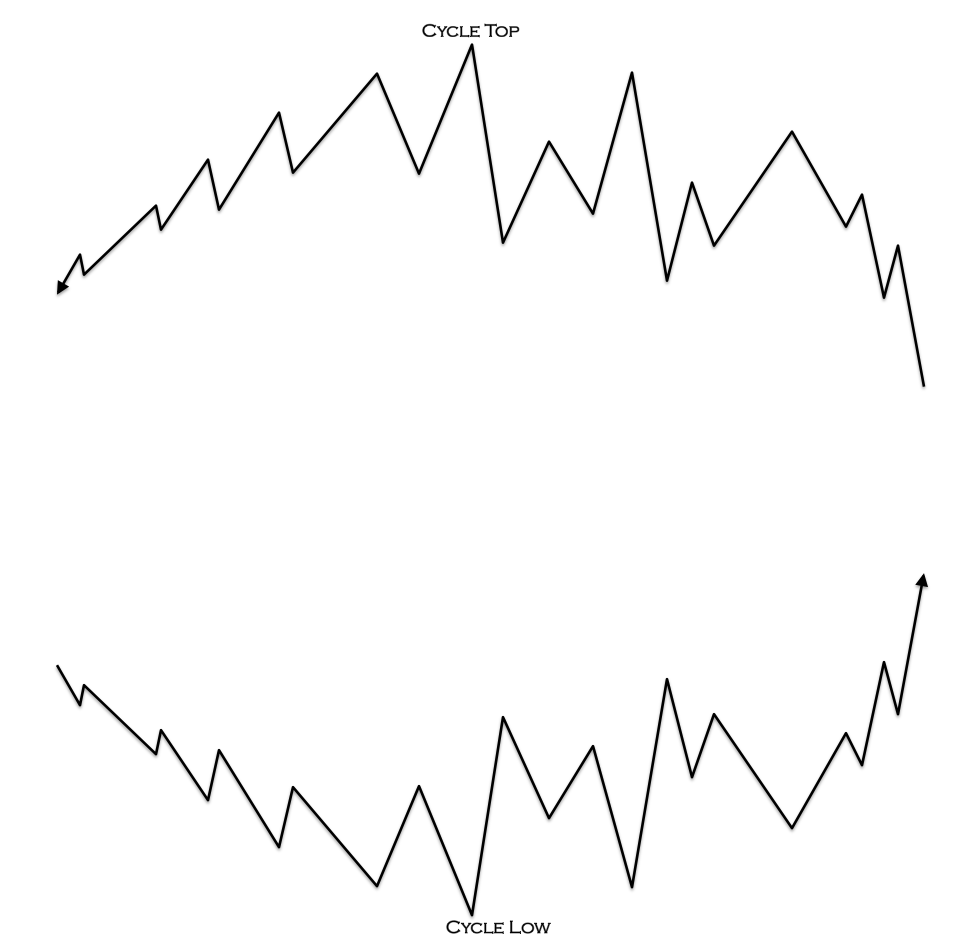
In a note at the end of May, we had updated our commentary on different symmetries - both mirrored and inverse, that had developed along varying time frames in 10-year yields (see Here). Essentially, trends were being replicated - from the mirrored symmetry of the long-term cycle, to its inverse structure that yields have been following over the past four years.
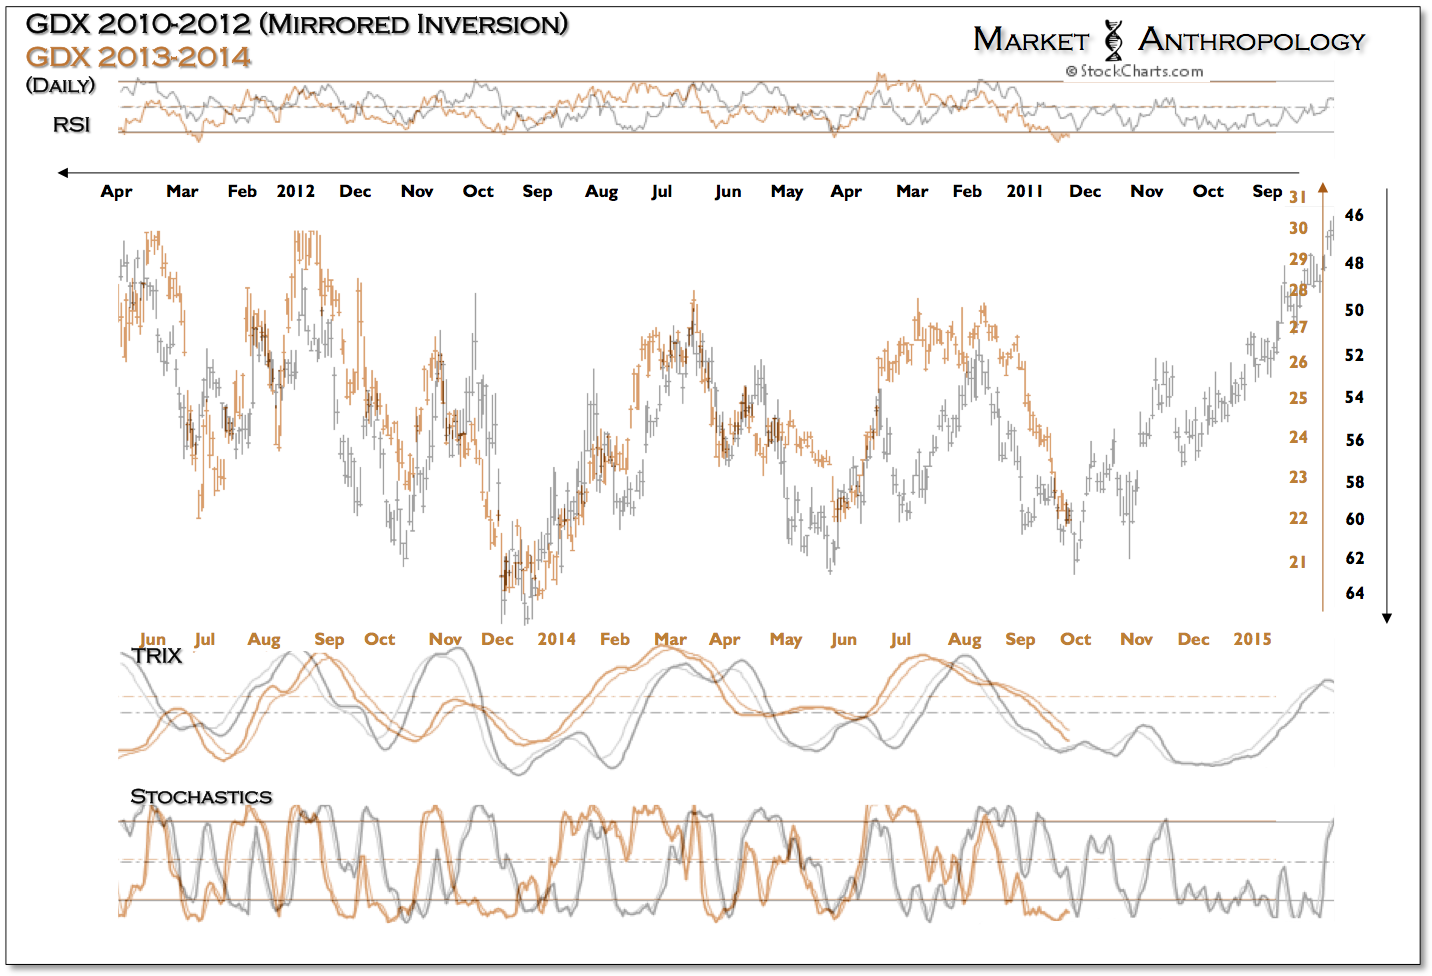
Mirrored relationships had also maintained form between long-term yields/gold and equities/gold. With yields acting as the common denominator, inverse symmetries have translated with similar complexity and breadth from the top of the cycle in gold miners to what has become an equally expansive inverse reflection.
The inverse symmetry of market reflexivity.
