Last week, the European Central Bank left interest rates and its quantitative easing program unchanged. The decision came as February’s inflation for the euro area reached 2% for the first time since 2013, with German inflation slightly above that level.
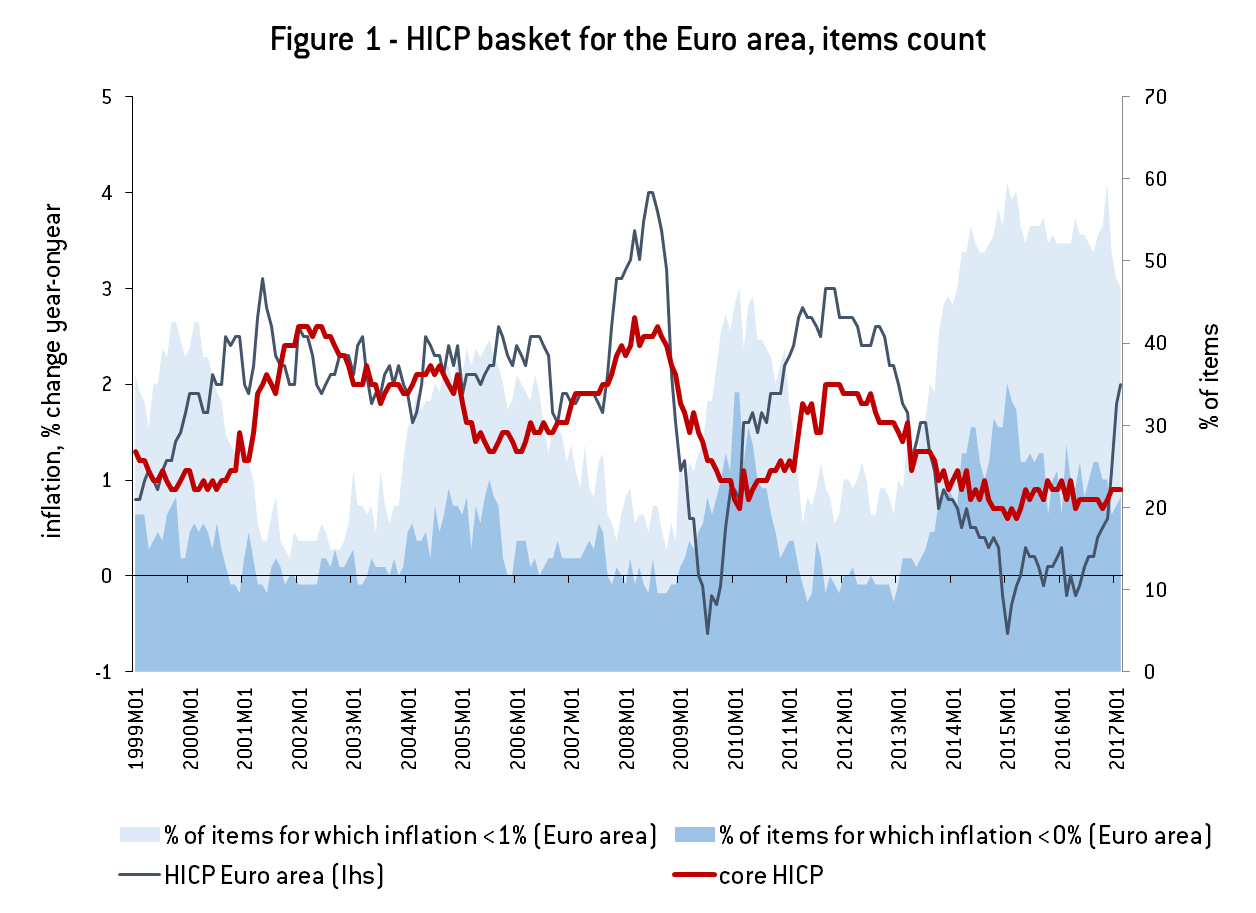
ECB President Draghi highlighted that there are no signs yet of a convincing upward trend in underlying inflation. Indeed, this stands out clearly if we look more in detail at the composition of the basket. Figure 1 shows the headline and core inflation rates for the euro area, together with the share of items in the Harmonised Consumer Price Index (CPI) basket that have experienced inflation rates below 1 and below zero. While the headline inflation rate for the EA has increased from 0.6% in November 2016 to 1.8% in January 2017 and 2% in February, the percentage of items that are in deflation has remained relatively high. As of February 2017, 21.3% of the EA HCPI basket was in deflation (up from 20.2% in January) and 47% of items experienced price growth below 1%.

Source: Bruegel based on Eurostat
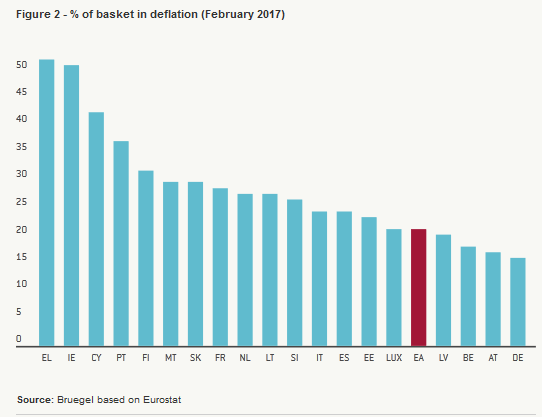
As always, the situation differs markedly at the individual country level. Three countries – Greece, Ireland and Cyprus – have more than 40% of their HICP basket in deflation, while eight more countries have had negative inflation on more than 25% of the basket. Germany, Belgium and Austria are the only countries where less than 20% of the HICP basket is in deflation (Figure 2, see also Table 1 at the end).

The increase in the headline inflation appears to be mostly driven by a surge in energy and vegetable prices. At the EA level, the rate of inflation for liquid fuels turned from -5.4% in November 2016 to +30% in January 2017, i.e. an increase of 35.6 percentage points. To the extent that market-based inflation expectations have a tendency to react strongly to changes in oil prices, the assessment in this moment should be cautious.
At the same time, inflation for vegetables went from -0.7% to +16.2% over the same period. In Germany between November 2016 and February 2017 liquid fuel price inflation increased by 32.2 percentage points and vegetable price inflation increased by as much as 23 percentage points. The latter phenomenon seems to be related to a supply shortage, due to the bad weather conditions in Italy and Spain.
As a result of these two developments, headline HICP inflation spiked during the last three months, while the core inflation rate – which excludes fuels and unprocessed food – remained flat at around 1%.
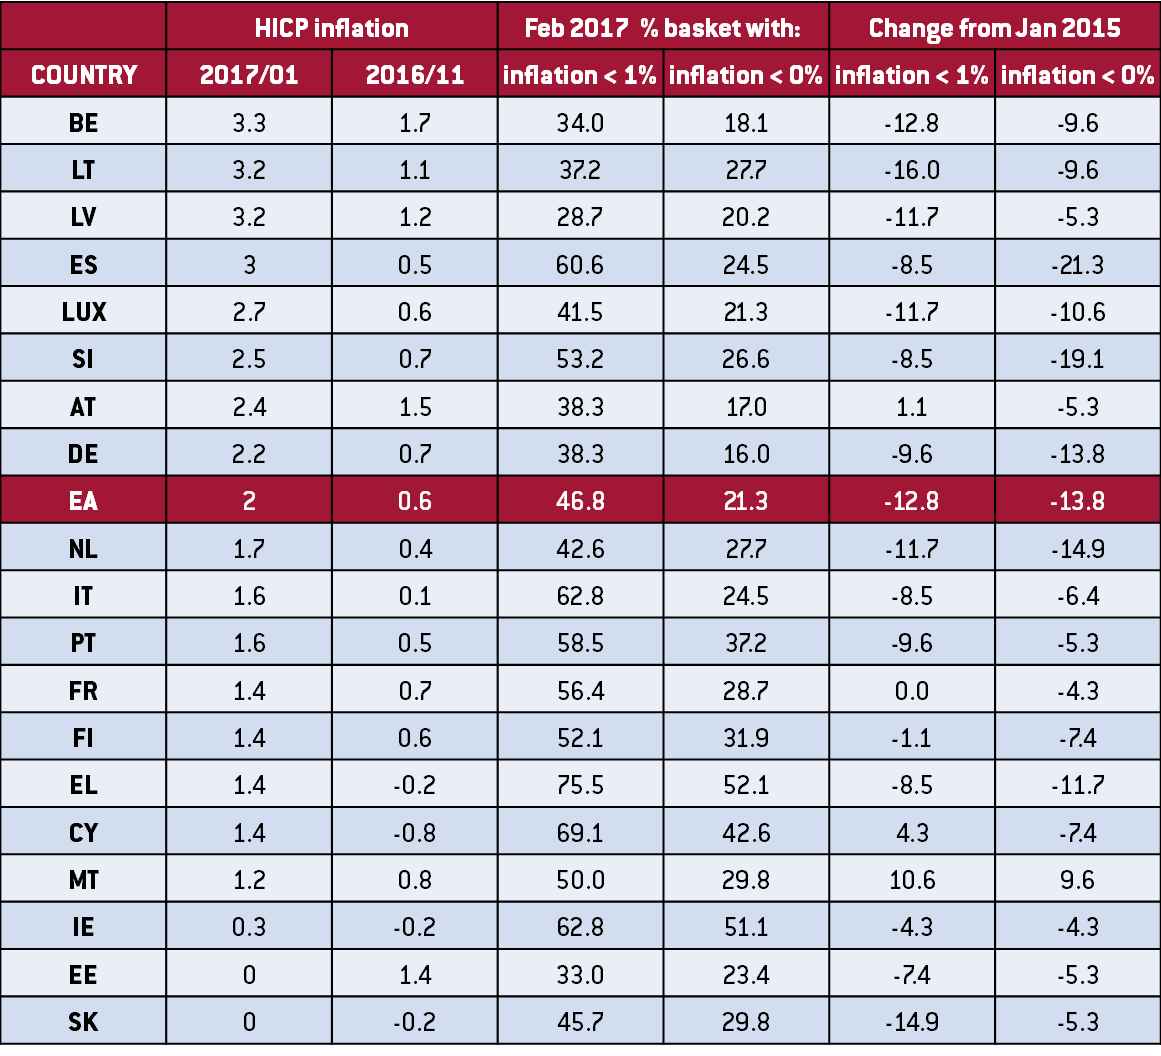
Importantly, the share of the HICP basket in deflation is not decreasing equally across countries. Table 1 shows that some countries – such as Spain, Slovenia and to some extent Germany – saw a dramatic reduction in the share of their HICP basket that is in deflation since the beginning of QE in 2015. In other countries, however, the improvement has been slow. In France, 29% of the HICP basket recorded negative inflation in February 2017, as opposed to 33% in January 2015. So the decrease has been much less pronounced. In Malta, the percentage of the basket in deflation has actually increased.
Overall, these indicators point to the fact that it may indeed be too early to speak of a “sustained upward trend” in inflation in the euro area.
Table 1 – Country-level data on HICP inflation and % of basket in low inflation or deflation

