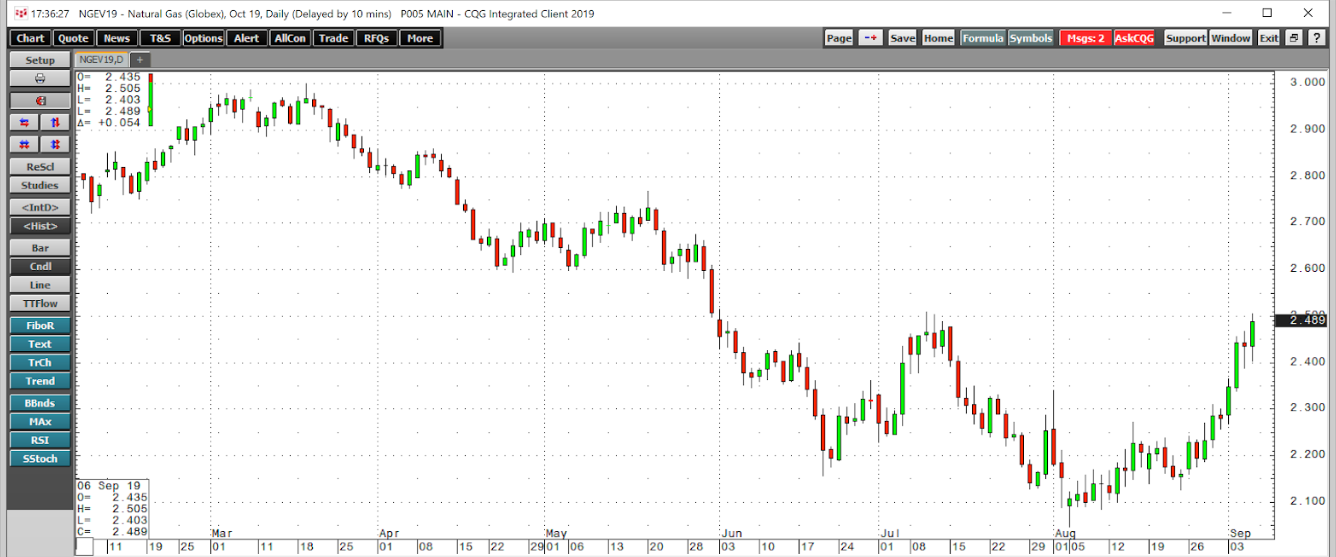
When a market has every reason to move lower, and it does not, it is often a sign that the path of least resistance of the price is higher. The price of natural gas fell below the 2017 and 2018 low in April 2019 and declined to the lowest level since 2016 at $2.029 per MMBtu in early August.
Hurricanes have a history of lifting the price of the energy commodity. In 2005 and 2008, a pair of ferocious storms took the price of natural gas future over the $10 per MMBtu level. At the end of August, Hurricane Dorian was approaching the US. The storm passed over parts of the Bahamas as a Category Five hurricane leaving a path of devastation in its wake. However, it missed a direct hit on Florida, and while it did more than a little damage in the Carolinas, the hurricane did not do much to push the price of natural gas higher.
At the same time, last Thursday’s inventory report from the Energy Information Administration was bearish. After a positive result from the storm and a higher than expected injection into storage, the price of natural gas did not move lower. The United States Natural Gas Fund (NYSE:UNG) is an ETF product that tracks the price of the energy commodity.
Hurricane Dorian lit a fuse
Reports that a massive hurricane was forming and could be heading towards the southern United States during the week of August 26 lifted the price of natural gas futures. The price rallied from under $2.20 per MMBtu on the nearby futures contract to the $2.31 level on the final trading session of August. As Florida and other states in the south braced for a direct hit, the price of the energy commodity closed before the long Labor Day weekend at $2.28 per MMBtu.
The first sign that the natural gas market was ready to move higher was its reaction when the storm missed Florida and a weaker than expected hurricane lashed the Carolinas. In the past, the wake of a hurricane that did not result in significant damage caused the price of futures to retreat. Natural gas moved higher in the wake of Hurricane Dorian. The weather lit a bullish fuse that the change in seasons kept burning.
Seasonality takes over- No significant reaction to the latest inventory report
After the Labor Day weekend, the natural gas futures market begins to look towards the season of peak demand that starts each year in mid-November. The injection season ends at the start of the winter as inventories in storage begin to decline. Therefore, the end of August and beginning of September is a reminder that the peak demand for the energy commodity is just around the corner.
The second sign that the path of least resistance for the price of natural gas has turned higher was its reaction to the September 5 data release from the Energy Information Administration. The market had expected an increase of around 71 billion cubic feet of natural gas for the week ending on August 30. News that stockpiles rose by 84 bcf did not cause selling but buying in the futures market.

(Source: CQG)
As the daily chart of October futures shows, the price of the energy commodity rose in the aftermath of the slightly bearish inventory data. Natural gas rose to a high at $2.505 per MMBtu on September 6 and settled at the end of last week at $2.496.
Watch the critical level on the upside
Natural gas prices broke down in April and fell to the lowest level since 2016 in early August at $2.029 per MMBtu. The technical level that gave way on the downside was at just over the $2.50 level. The low from 2018 was at $2.53, and in 2017 the bottom was at $2.522 per MMBtu. The levels that stood as critical support are now technical resistance levels. Therefore, a rise above $2.53 in the nearby futures contract could cause both short covering and speculative buying this week. Moreover, seasonality favors a price recovery now that we are in September.
Few assets move like the natural gas futures market. In 2018, the price rose to its highest level since 2014 at $4.929, and in 2019 it fell to the lowest price since 2016 at $2.029. Natural gas closed last Friday within four cents of a level that could trigger lots of excitement in the market over the coming days and weeks.
The United States Natural Gas Fund L.P. (UNG) was trading at $22.34 per share on Monday afternoon, up $0.76 (+3.52%). Year-to-date, UNG has declined -4.20%, versus a 12.07% rise in the benchmark S&P 500 index during the same period.
UNG currently has an ETF Daily News SMART Grade of C (Neutral), and is ranked #51 of 109 ETFs in the Commodity ETFs category.
