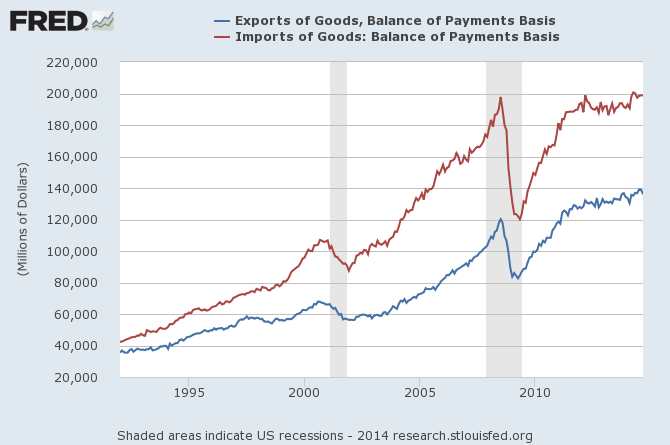
There is a ying and yang in trade. Major exporting countries are generally major importing countries. Most analysis centers on exports - and therefore misses the big picture in our globalized trade world.
Follow up:
There is a correlation between exports and imports. Take the USA for example - the movements of exports and imports seems to be choreographed.
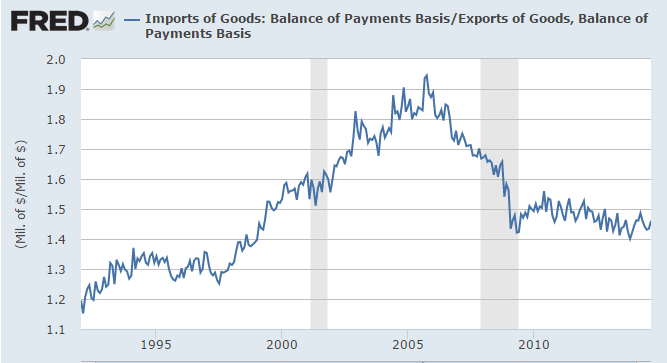
What changes over time is the ratio between exports and imports - caused by evolutionary conditions such as needing less energy per capita or changing demographics or technological advances.
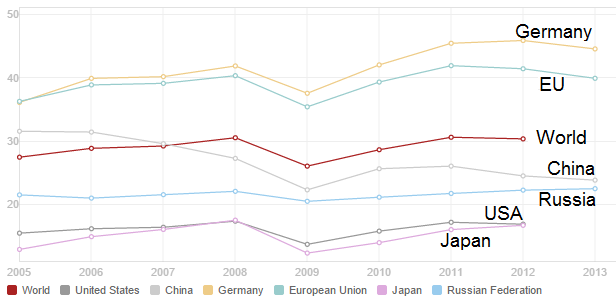
Dipping into the data base at the World Bank, one can see the relationship between imports and exports of various selected countries. I cannot validate how the World Bank came up with the percentages of GDP - but I can validate that the general relationships are correct between imports and exports. From the World Bank:
Imports of goods and services (% of GDP)
Imports of goods and services represent the value of all goods and other market services received from the rest of the world. They include the value of merchandise, freight, insurance, transport, travel, royalties, license fees, and other services, such as communication, construction, financial, information, business, personal, and government services. They exclude compensation of employees and investment income (formerly called factor services) and transfer payments.
Imports into Selected Countries
Exports of goods and services (% of GDP)
Exports of goods and services represent the value of all goods and other market services provided to the rest of the world. They include the value of merchandise, freight, insurance, transport, travel, royalties, license fees, and other services, such as communication, construction, financial, information, business, personal, and government services. They exclude compensation of employees and investment income (formerly called factor services) and transfer payments.
Exports from Selected Countries
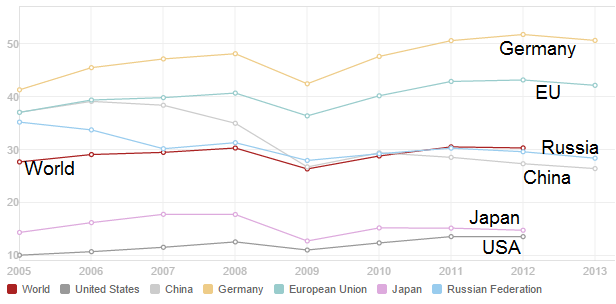
There is a general slowdown currently in the global economy - slowing economies trade less. This slows money flows between countries. It is logical that the major exporting / importing countries (such as the EU) will be the hardest hit - whilst the USA and Japan (where trade is not a major component of the economy) should be the least affected.
What concerns me is the drop in oil prices (which is reportedly caused by the increase in supply thanks to USA fracking). This drop in oil prices is causing in a drop in value of global trading of oil. As movements of imports and exports are choreographed, this means that an oil exporting country will be importing less (thus reducing the exports from other countries). This is occurring simultaneously with a slowing global economy. Relatively fast change is disruptive, although in the longer run - after a new equilibrium is reached - will ultimately be either overall beneficial or detrimental to each country.
The ying and yang of trade:
- slowing economies cause a contraction in trade;
- dropping unit trading cost of a major commodity (say oil) will contract trade.
What is the tipping point when a small contraction causes a cascade into a larger contraction? What are the economic multipliers involved here?
A contraction of money flows for oil at the same time as a slowing cycle in economic growth could have unpredictable consequences. Not that we are about to repeat the Great Financial Crisis, but the last time oil crashed and global economies were slowing was 2008. This time oil has fallen by a smaller amount, but the global economy was probably stronger in 2008 (leaving out the credit crisis in the third quarter) so the overall impact may not be that different in total. But this time there doesn't appear to be an imminent credit crisis to deliver a sledgehammer blow. The economic trajectory now may be less precipitous than 2008 but there is definitely some downside risk from here into 2015.
Other Economic News this Week:
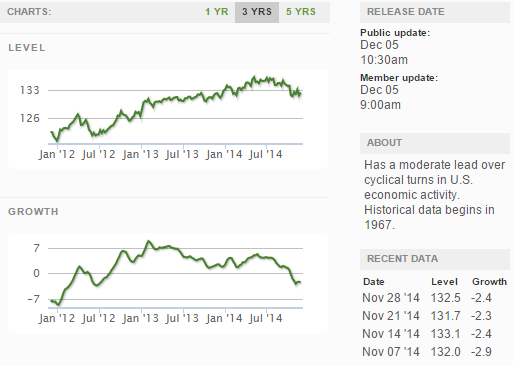
The Econintersect Economic Index for December 2014 is showing our index on the high side of a tight growth range for almost a year. Although there are no warning flags in the data which is used to compile our forecast, there also is no signs that the rate of economic growth will improve. Additionally there are no warning signs in other leading indices that the economy is stalling - EXCEPT ECRI's Weekly Leading Index which is slightly below the zero growth line.
The ECRI WLI growth index value crossed slightly into negative territory which implies the economy will not have grown six months from today.
Current ECRI WLI Growth Index
The market was expecting the weekly initial unemployment claims at 290,000 to 300,000 (consensus 295,000) vs the 297,000 reported. The more important (because of the volatility in the weekly reported claims and seasonality errors in adjusting the data) 4 week moving average moved from 294,250 (reported last week as 294,000) to 299,000. Rolling averages under 300,000 are excellent.
Weekly Initial Unemployment Claims - 4 Week Average - Seasonally Adjusted - 2011 (red line), 2012 (green line), 2013 (blue line), 2014 (orange line)
Bankruptcies this Week: Republic of Singapore-based Bumi Investment Pte (Chapter 15), Privately-held Deb Stores Holding (aka Deb Shops), Privately-held American Laser Skincare (pka American Laser Centers and Bellus ALC Acquisition)
Click here to view the scorecard table below with active hyperlinks
Weekly Economic Release Scorecard:
