SPECIAL SECTION: Engineering the Rules-Based Strategy:
How does one concoct the type of strategy that has been recommended in each of the reports since August 2019? This section is dedicated to helping fellow madmen with such engineering.
From the March 4, 2020 report, “Prepping For The Next Wave Lower”:
“To refresh, an appropriate put-combination strategy that is geared for these markets should provide positive results following a positive quarter, while aiming to profit in the 65-95% range after a bear market-style quarterly decline of 8 - 10%.”
Each and every article since the August report linked below, stressed the need to be positioned for a 10,000 point Dow smash with a strategy such as the one above. As we see from the second of the excerpts below, it did not matter if the Dow would continue to rise for the last 4 months of 2019, or if the debacle would have commenced then.
From the August 29, 2020 report, “History Repeating Itself? 1987, 2001, 2008….2019?”
“For the very sophisticated who do not wish to feel that preserving the capital committed to the strategy is dependent on a sharp downturn, an option combination should be devised whereby a positive return is generated as a result of a favorable quarter. Such a strategy would likely include a calendar-price spread, using both long and short put options.”
“With that, one may expect an initial (and possibly yearend) crash to the 16,000 – 18,000 area. Many ought to employ strategies that are not dependent on the latter event. That said, however, be prepared now for precisely such a debacle.”
The recipe’s components:
Generally, a shorter-dated put option is written to gain income that is used to purchase longer-dated insurance. The latter must be engineered to provide substantial leverage in the event of an 8-10% Bear market-style quarterly decline. Meanwhile, the former also serves to generate profits resulting from a bullish quarter. Above all, the engineering must be structured to be weighted to tie the dramatic returns to sharp declines, while only generating moderate profits in the bullish scenario. If one were not so extremely bearish as I am, the engineering would be weighted otherwise.
The mathematical relationship between the shorter-dated and longer-dated contracts should be tied to a rules-based strategy that includes a trigger for realizing dramatic profits after a sharp decline, as well as a rule for actively responding to any decline in the longer-dated put beyond some point, which is price and time-related, in the event of a continued rise in the market. It is important that the longer-dated put maintain sensitivity to market declines, so as to protect against the risk inherent in the shorter-dated leg.
The mathematical relationship between the contracts must provide exceptional downside leverage, which also hedges against any risk assumed by the shorter-dated position. The latter must itself contain a component that hedges against mushrooming losses in the shorter-dated put, in the event of sharp near term declines such as those that we have been experiencing.
The mathematics and ratio are inseparable from the strike prices and expiry dates of the respective contracts and how they are selected. These are inseparable moving parts within the above-referenced mathematical ratio/equation.
Finally, once all the relationships (equations) have been worked out, including the rules-based strategy, the latter must contain a component for determining when to reinvest after realizing dramatic gains. Therefore, the reference to the VIX component immediately below is critical for the management of such a strategy and where we are today.
Again from the March 4, 2020 report:
“Last week’s report reminded that the put program aims to remain invested regardless of whether or not the market is viewed as peaked or bottomed, the exception being when the VIX levels are too high post-liquidation (discussed below).
“Last week’s article explained that the principal consideration in determining the timing for reinvestment after liquidation is the level of the VIX, so as to ensure not overpaying for the newly established combination. For this reason, the report added that the opportunity should present itself early this week (the article wrote “March 1,” which was a Sunday).
“As the chart below reflects, the VIX fell to 25 (24.93) when the Dow crawled over 27,000. The engineering of my own program calls for re-entry on a break of 27.5, so this suggests a newly opened combination. Since we are anywhere but at a peak, the aim of the engineering is to collect income that pays for the protection.”
Historic VIX levels, such as those that we are presently witnessing, make for great income (high near term put prices), as well as protection in the short term, therefore. However, if one were to establish a new post-liquidation position with the VIX at, say, 50, the downside trigger would be hit too quickly and would therefore NOT provide a great deal of leverage to the downside.*
Above, I referred to the relationship (mathematics and the ratio) between the shorter and longer-dated contracts. The mathematics is inseparable from the strike prices and expiry dates of the respective contracts and how they are selected. These are inseparable moving parts within the above-referenced mathematical ratio/equation.
And therein is the rub.
*The mathematical ratio/equation is the basis in relation to which one is to derive the rules-based strategy that adorns and makes functional the relationship and ratio between the shorter and longer-dated put option contracts.
Dow analysis and conclusion:
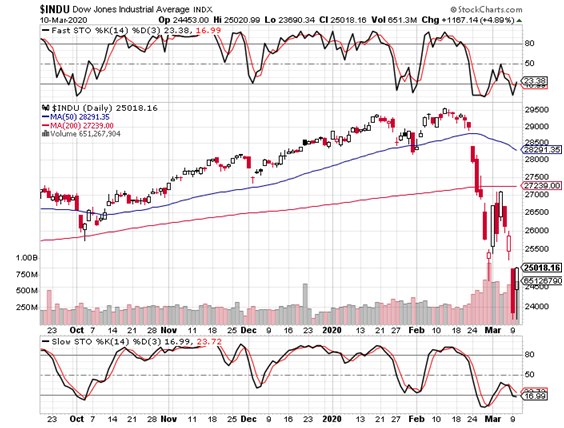
By making a new low today, however slight, the momentum indicators seen in the 6-month Dow chart below have put in bullish divergences (the slow stochastic below the graph is the more important).
Per the commentary in the first section above, the income and protection strategy is again open, and I assess the overshoot level to which the Dow could now attain to be around 27,250, as opposed to the ~28,100 area cited in the March 4 report, the related excerpt of which appears immediately below.
“The Dow’s correction can overshoot to 28,100, at which point a more aggressive stance would likely be assumed, as was the case at the recent all-time-high.”
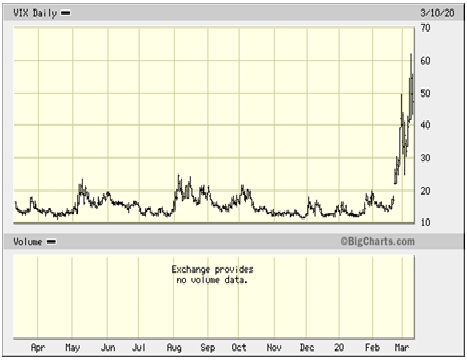
As the 1-year VIX chart below illustrates, it has completed 5 waves up, which is consistent with the conclusion that the Dow concluded a 5-wave decline today.
Secondly, the VIX put in a divergence versus the Dow, which, in and of itself, is also bullish short term.
Thirdly, the VIX’s peak yesterday was the 2nd-highest ever and the greatest since the shocking 90-area in 2008!
In other words, expect that the 10,000-point top-to-bottom debacle forecast in these pages to have transpired with amazing speed in 2020.
Reiterating, the more the authorities tamper with free markets, the worse is the ultimate loss of control. My own view, however, is that the manipulators are the ones making the bets anyway, for many purposes that are not in the public mind. Hence, also as analyzed in the past, often what appears to be a loss of control may be precisely that, an appearance of lost control?
Nothing changes strategy anyway, save for near-term trading, about which, in this case, I do not comment; short term trading is not the concern of these pages since it is highly speculative to make countertrend trades.
Near-term analysis has value for timing pertaining to bearish strategies, but the strategic approach advised in these pages obviates the need to have such concerns.
Silver (SLV) analysis and strategy:
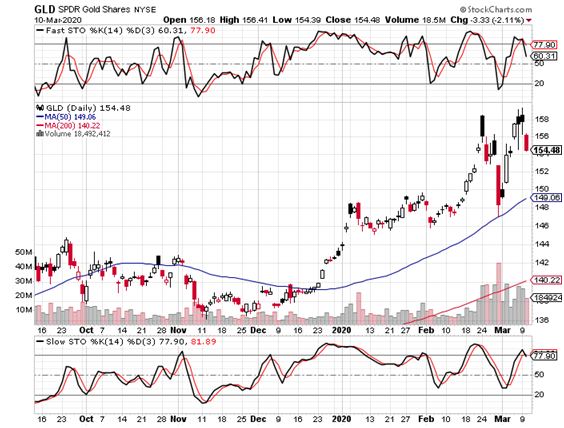
Gold’s (GLD’s) 6-month chart follows and its momentum indicators have turned down from lofty levels. Moreover, the GLD stochastic indicates a double-divergence that dates to the end of 2019.
The previous reports also discussed the phenomenon of gold actually correcting within an uptrend and that its trend is determined by inferring it from the silver chart.
I explained the counterintuitive form of such analytic interpretation so that one not be shaken out of long term gold positions by sharp declines, such as the $40-60 smash that I expect in the near term; most of that smash could even occur tomorrow (Wednesday March 11).
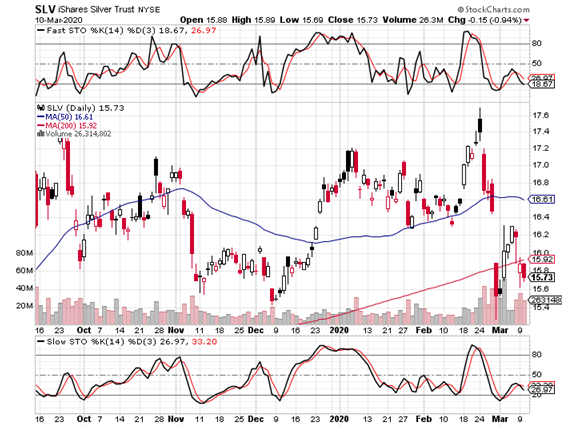
Consistent with the contemplated quick ~$50 hit to gold, the 6-month silver (NYSE:SLV) chart below would reflect a bullish divergence in the stochastic if the SLV were to take a violent but quick smash of its own of ~50 cents to a new low at ~$15.25.
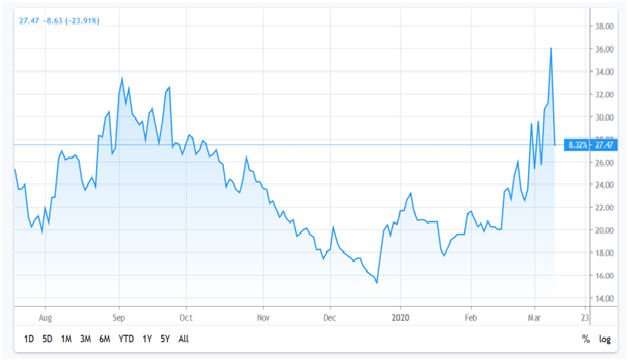
The 8-month VXSLV chart (SLV option volatility premiums) appears below.
From the March 4 report:
“This picture of the SLV’s options’ time premiums explains why options have not been hurt relative to the price decline. The nearly 100% move higher from its 4th quarter low reflects this fact, but it also suggests that there is room for quite a premium hit if volatility were to cool down.”
The VXSLV subsequently shot even higher to complete a more than 100% move from its December bottom.
Today, as one can see, the VXSLV finally got nailed and inflated option prices got hurt. However, it would get much worse with a near term 50 cent smash and another collapse in the VXSLV, which would be helped along by any cooling in the VIX (the stock market’s principal volatility gauge).
STRATEGY
The best way for silver investors and traders to time adding positions would be to use the VXSLV chart below. It should be treated as an asymmetric indicator that should be used to go long additional silver and silver options at a VXSLV level of ~21(i.e. - option prices would be screamingly cheap).
CONCLUSION
Revisiting the August 29, 2020 report, History Repeating Itself? 1987, 2001, 2008….2019?:
“These asset classes’ (stocks and precious metals) asymmetric performance not only represents the very long term norm, but is also the condition by which one could enjoy exponentially increasing profits, owing to an eruption in these asset classes’ volatility premiums from their respective historic lows.”
The VIX and VXSLV have erupted and asymmetric performance is confirmed and growing, all to the spectacular performance of those who followed strategies aimed at profiting from such an eventuality.
Apart from the 2 reports that are linked in this article, hereunder, please find the other 5 reports which are linked below for easy reference. Among other things, they include (a) the forecast of a 10,000 Dow debacle and $10 rise in silver as strong possibilities in 2020, (b) the reiterated forecast to short at a level approaching, but below, 30,000, (c) the explanation that there comes a point when the authorities WANT markets to collapse, so as to provide cheaper prices for the acquisition of strategic assets and, finally, (d) why it is a mistake to believe that the collapse will have taken place solely due to a specific story, such as the virus.
The plausibility of the analyses comes into greater focus when they are taken into consideration jointly, notwithstanding the correctly forecast outcomes. The latter is not necessary to claim proof of the assertions made, though they obviously lend credibility to the different analyses made in these pages, which included an invitation to investors to make certain studies themselves, of proofs of different market phenomena that were provided in previous linked reports.
This is a time for action, and fruitful action stems from study.
- Realizing Major Q1 Profits February 26
- Dow Heads Toward 30,000. Here's The Best Investment Strategy February 6
- Perfect Dow Peak, Higher Silver Low? January 23
- Dow Down 10,000, Silver Up $10? Part II January 6
- Dow Down 10,000, Silver Up $10? December 2
