When I lived in the corporate world, we used global and domestic transport to forecast the economy. The reason was that transport led economic activity.
Follow up:
Rail is a particularly useful crystal ball as it is a prime mover of goods to and from ports (international trade) - as well as the domestic movement of goods. The death spiral of rail movements continues to be concerning.
Rail moves raw materials to manufacturers. Rail moves much of the processed and manufactured goods from manufacturers to other manufacturers / wholesalers. With some exceptions, most movement to final points of sale is by truck. The rail movements occur many months before final sales - and therefore offer forecasting foresight.
Rail data comes in two major parts - carload (mainly raw and semi-processed materials) and intermodal (mainly finished goods in sea containers and semi-trailers moved on rail). Carload rail movements have steeply declined beginning in early 2015, while intermodal's decline began in early 2016.
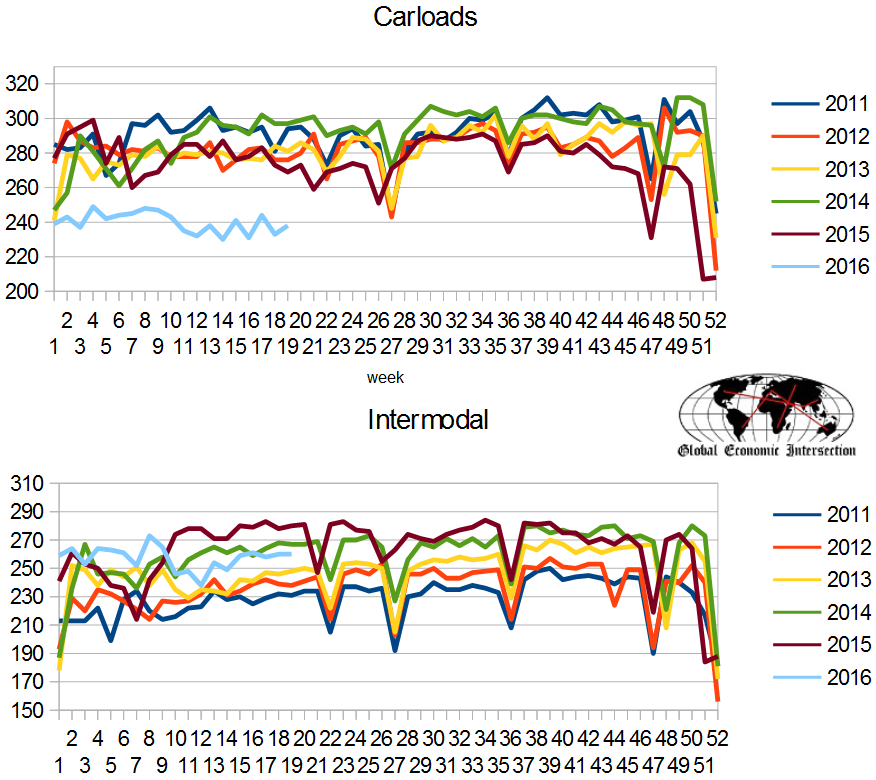
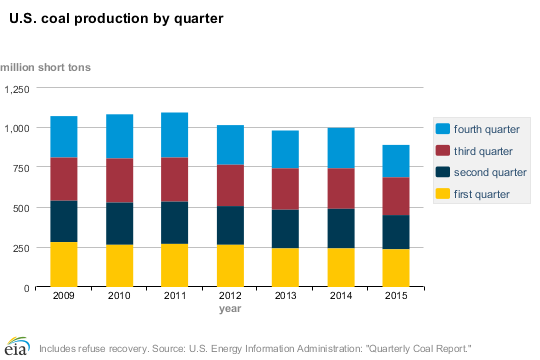
The problem with analyzing the data for carloads is that it includes coal - and coal mining has been in significant decline over a long period of time.
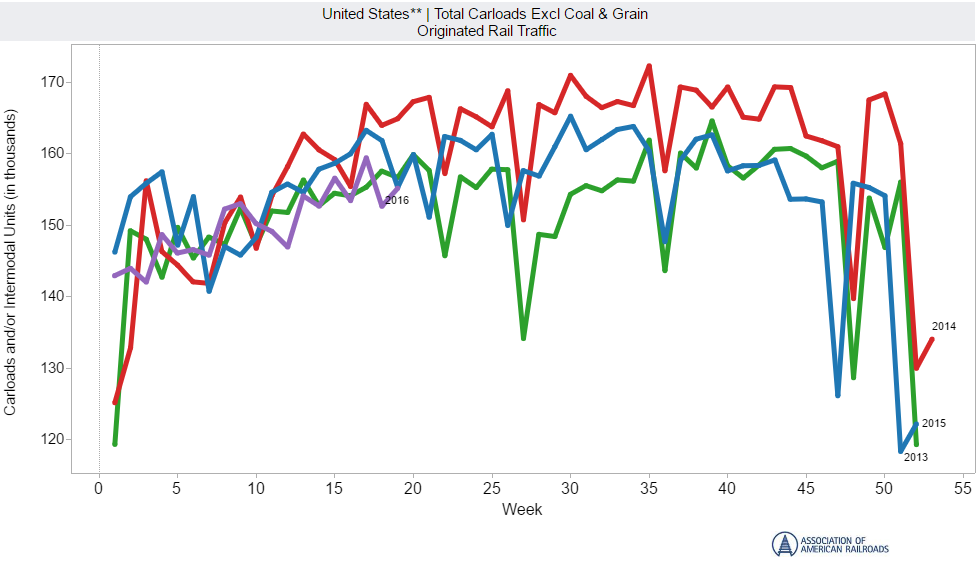
But even removing coal and grain (grain is not economically intuitive) from the analysis - carloads are bouncing along at two year lows (purple line on below graph).
Prior to the Great Recession, rail contraction would have resulted in a recession. In the New Normal, the current rail contraction did not.
This rail contraction is hard to rationalize as it is deeper than the decline in industrial production - and the purchase of goods by consumers was weakly expanding throughout the rail decline. What I am trying to say is that it seems that the amount of final sales of goods seems little diminished, yet the movement of materials is contracting. Are we buying the same goods in smaller packages so shipping volumes are smaller?
Other Economic News this Week:
The Econintersect Economic Index for May 2016 marginally dropped into contraction. The index is at the lowest value since the end of the Great Recession. Is this a recession warning? This index is not designed to guess GDP - or the four horsemen used by the NBER to identify recessions (industrial production, business sales, employment and personal income). It is designed to look at the economy at main street level. A general concern is that current data is being compared against relatively soft historical data - both month-over-month and year-over-year. The current data should be showing more comparative strength. At this point in time - I believe it is possible, but not probable, that a USA recession is either underway or will soon occur. The data which comprises elements of GDP are VERY weak but not yet recessionary - and there is little in the data yet to suggest a further drop in trends. Most major GDP elements are flat (the rate of growth is not changing), or there is a slight upward bias in the trend lines.
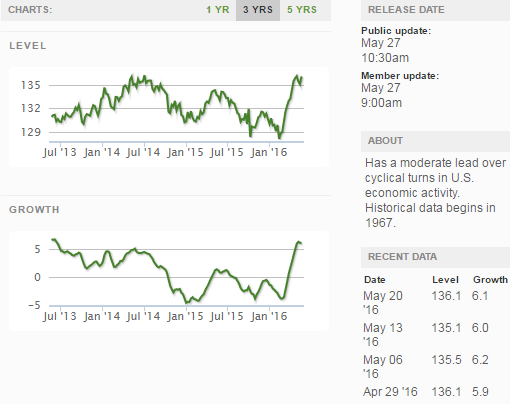
Economic Cycle Research Institute (ECRI) Weekly Leading Index (WLI) Growth Index is now in positive territory and forecasting a marginally strengthening economy six months from now.
Current ECRI WLI Growth Index
The market expectations for weekly initial unemployment claims (from Bloomberg) were 263,000 to 275,000 (consensus 267,000), and the Department of Labor reported 294,000 new claims. The more important (because of the volatility in the weekly reported claims and seasonality errors in adjusting the data) 4 week moving average moved from 258,000 (reported last week as 258,000) to 268,250. The rolling averages generally have been equal to or under 300,000 since August 2014.
Weekly Initial Unemployment Claims - 4 Week Average - Seasonally Adjusted - 2011 (red line), 2012 (green line), 2013 (blue line), 2014 (orange line), 2015 (violet line)
Bankruptcies this Week: Privately-held Intervention Energy Holdings Intl (OTC:EGYH), Perseon Corp (OTC:PRSN) (f/k/a BSD Medical)
Weekly Economic Release Scorecard:
