The Hill’s Group
Gold mines usually don’t run out of gold, and tin mines usually don’t run out of tin, but they are often shut down. They close their doors and go out of business. That is because the quality of the ore remaining fell too low for them to be worked economically.
The 2000 WEO (World Energy Outlook) placed liquid hydrocarbon resources at as much as 4,300 Gb (billion barrels). The world in the last 158 years has extracted less than 1,700 Gb. “Running Out" is an oxymoron. Going out of business isn’t!
Gold mines, tin mines and oil wells are operated to make a profit. Investor put up money, and expect a return on their investment. If they don’t get it the business is sold, or scrapped out. It is that return that determines if an operation is continued, or shut in. It has absolutely nothing to do with the quantity of resource that remains in the ground?
The Bell Weather of the petroleum industry, Exxon (NYSE:XOM), has seen its ROA (return on assets) decline by 65% in the last four years. It has fallen from 13.45% to 4.8%. The decline for the return on its assets went down right along with the price of oil; which fell from $94.05 in 2012 to $48.67 in 2015. If it follows that trend its ROA will hit zero at about $30. During the first 10 months of 2016 the price of WTI (crude oil) averaged $39.40. At an ROA of zero its investors will see no benefit from their investment; except perhaps for the company’s scrap value.
As we have been saying for the last three years, the long-term trend for the price of oil is down:

The price of petroleum is controlled by two factors:
1) The cost of production.
2) The $ amount that the end consumer (the NEGs) can afford to pay for it.
What the end consumer pays must be sufficient to cover the cost of production. All production cost must be borne by the end consumer, who includes the end buyer, and the societal cost required to produce petroleum, and its products.
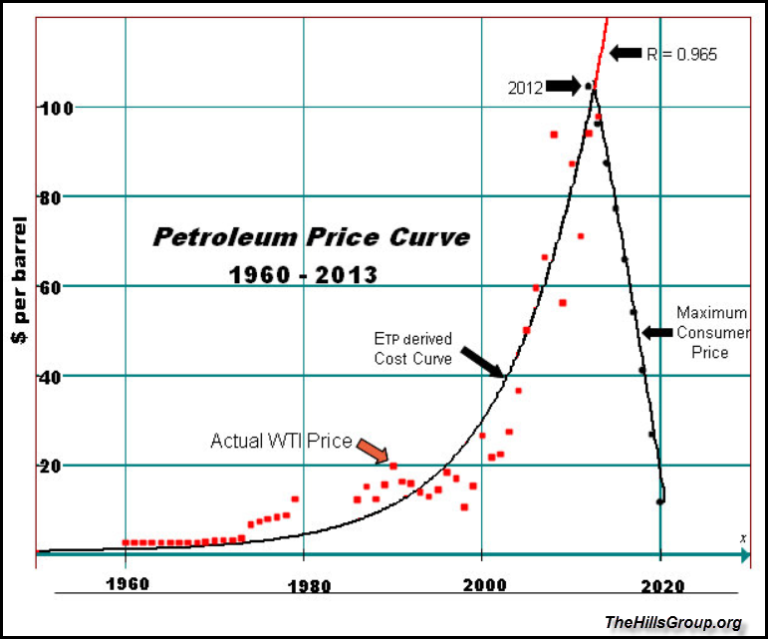
The Petroleum Price Curve, shown below, reflects the two factors that have, and will continue to control petroleum prices. The ETP derived Cost Curve is constructed from the ETP model, and has mapped the price of petroleum since 1960 with a correlation coefficient of 0.965. It is the most accurate pricing model that has ever been developed.
The Maximum Consumer Price curve was also developed from the ETP model. It represents the maximum price that the end consumer can pay for petroleum. It is based on the observation that the price of a unit of petroleum can not exceed the value of the economic activity that the energy it supplies to the end consumer can generate.
The quality of the resource (measured by its ability to deliver energy) has fallen low enough that its ROA is rapidly approaching zero. The 158 year history of the commercial industrial oil age has been spearheaded by a quest for the very best that could be found. What remained was of lower quality. That resulted in lower production wells, higher levels of contaminates, much higher or much lower viscosity, and ever increasing water cut. The overall reserve has declined in quality.
