NVDA Q3 Earnings Alert: Why our AI stock picker is still holding Nvidia stockRead More

The Golden Touch

Published 01/25/2018, 08:26 AM
XAU/USD
-
GC
-
GLD
-

Greek legend has it that King Midas obtained the ability to turn everything he touched into Gold after an act of kindness. The King was ecstatic as he turned everything in his Palace into Gold. But then as his food and drink turned to Gold before he could eat and drink them he cursed his power. I wonder if there is someone today that is in the ecstatic phase of this parable turning everything to Gold he touches?
Gold Chart

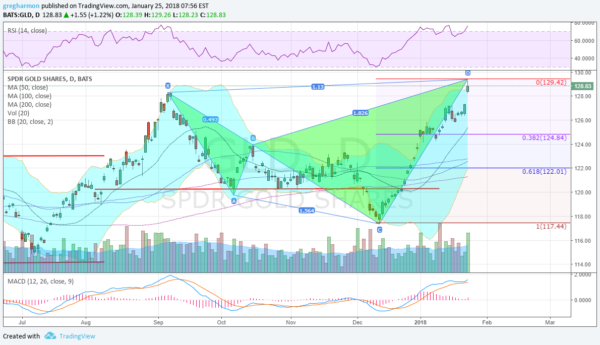
The broad stock market sure looks like Gold. And in fact Gold itself looks to be having a great run higher in price. The chart above of the Gold ETF (NYSE:GLD) shows how Gold has run up since a low in early December. It is now breaking above the September 2017 high after setting that higher low in December. It also shows a bearish harmonic Shark pattern, highlighted by the two triangles. This pattern looks for a move to that 113% extension of the initial leg lower from ‘X’ to ‘A’ and then a reversal of 38.2% or 61.8% of the full pattern. These retracements come at about 125 and 122 in the ETF. The pattern does not trigger until a Terminal Price Bar prints, with price rising through the 113% level and closing below it.
Gold Chart

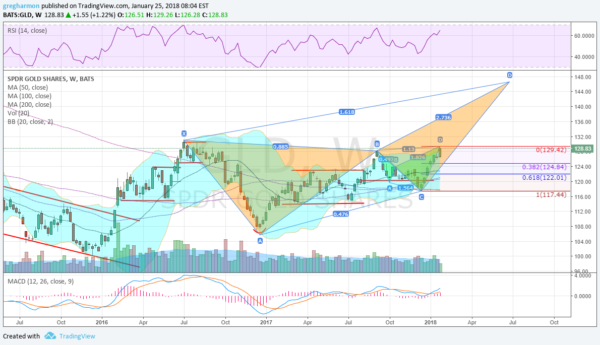
These patterns are not a guarantee of a reversal. And in fact they fail quite often when they exist within a larger harmonic pattern. This is the case with Gold. The longer perspective weekly chart of the Gold ETF above shows the Shark embedded within a Deep Crab harmonic (orange) that is now triggering with a move over that September high. This gives a target to about 146 above. So the combination suggest a potential stall or short term pullback that then reverses and continues much higher.

The information in this blog post represents my own opinions and does not contain a recommendation for any particular security or investment. I or my affiliates may hold positions or other interests in securities mentioned in the Blog, please see my Disclaimer page for my full disclaimer.

Original post

Latest comments

Loading next article…
Risk Disclosure: Trading in financial instruments and/or cryptocurrencies involves high risks including the risk of losing some, or all, of your investment amount, and may not be suitable for all investors. Prices of cryptocurrencies are extremely volatile and may be affected by external factors such as financial, regulatory or political events. Trading on margin increases the financial risks.
Before deciding to trade in financial instrument or cryptocurrencies you should be fully informed of the risks and costs associated with trading the financial markets, carefully consider your investment objectives, level of experience, and risk appetite, and seek professional advice where needed.
Fusion Media would like to remind you that the data contained in this website is not necessarily real-time nor accurate. The data and prices on the website are not necessarily provided by any market or exchange, but may be provided by market makers, and so prices may not be accurate and may differ from the actual price at any given market, meaning prices are indicative and not appropriate for trading purposes. Fusion Media and any provider of the data contained in this website will not accept liability for any loss or damage as a result of your trading, or your reliance on the information contained within this website.
It is prohibited to use, store, reproduce, display, modify, transmit or distribute the data contained in this website without the explicit prior written permission of Fusion Media and/or the data provider. All intellectual property rights are reserved by the providers and/or the exchange providing the data contained in this website.
Fusion Media may be compensated by the advertisers that appear on the website, based on your interaction with the advertisements or advertisers.
© 2007-2024 - Fusion Media Limited. All Rights Reserved.