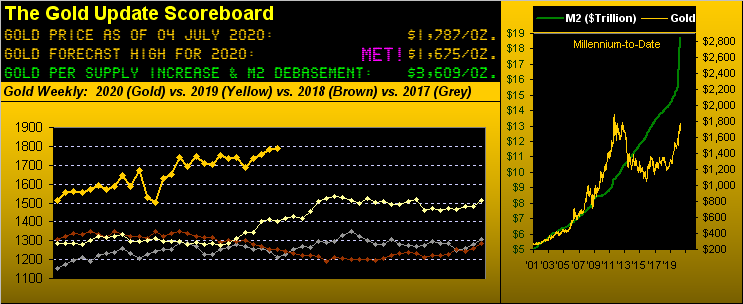
Gold at long (unthinkably) last has taken The Northern Front (1750-1800), reaching the Big Round Number this past Tuesday (30 June) at precisely 07:52:16 Pacific Daylight Time, furthering the upward glide to as high as 1807 come Wednesday (01 July) ... before pulling back to as low as 1766 toward then settling out the week 1787.
"So it didn't stay above 1800, mmb..."
Subjectivity run amok there, Squire. One might thus opine whilst Gold has "taken" The Northern Front, that it hasn't actually "won" it. At what point victory? Subjectivity, indeed. We'd like to see what had been resistance from 1750-1800 now morph into support from 1800-1750, enhanced by further progress up into the less resistive Final Frontier (1800-1900). At what point failure? A weekly close sub-1750, (notwithstanding still having the fundamental fuel to then again fight back upward).
Either way, Gold year-to-date has been comparatively great, it having worked its way to the top of the BEGOS Markets Standings:
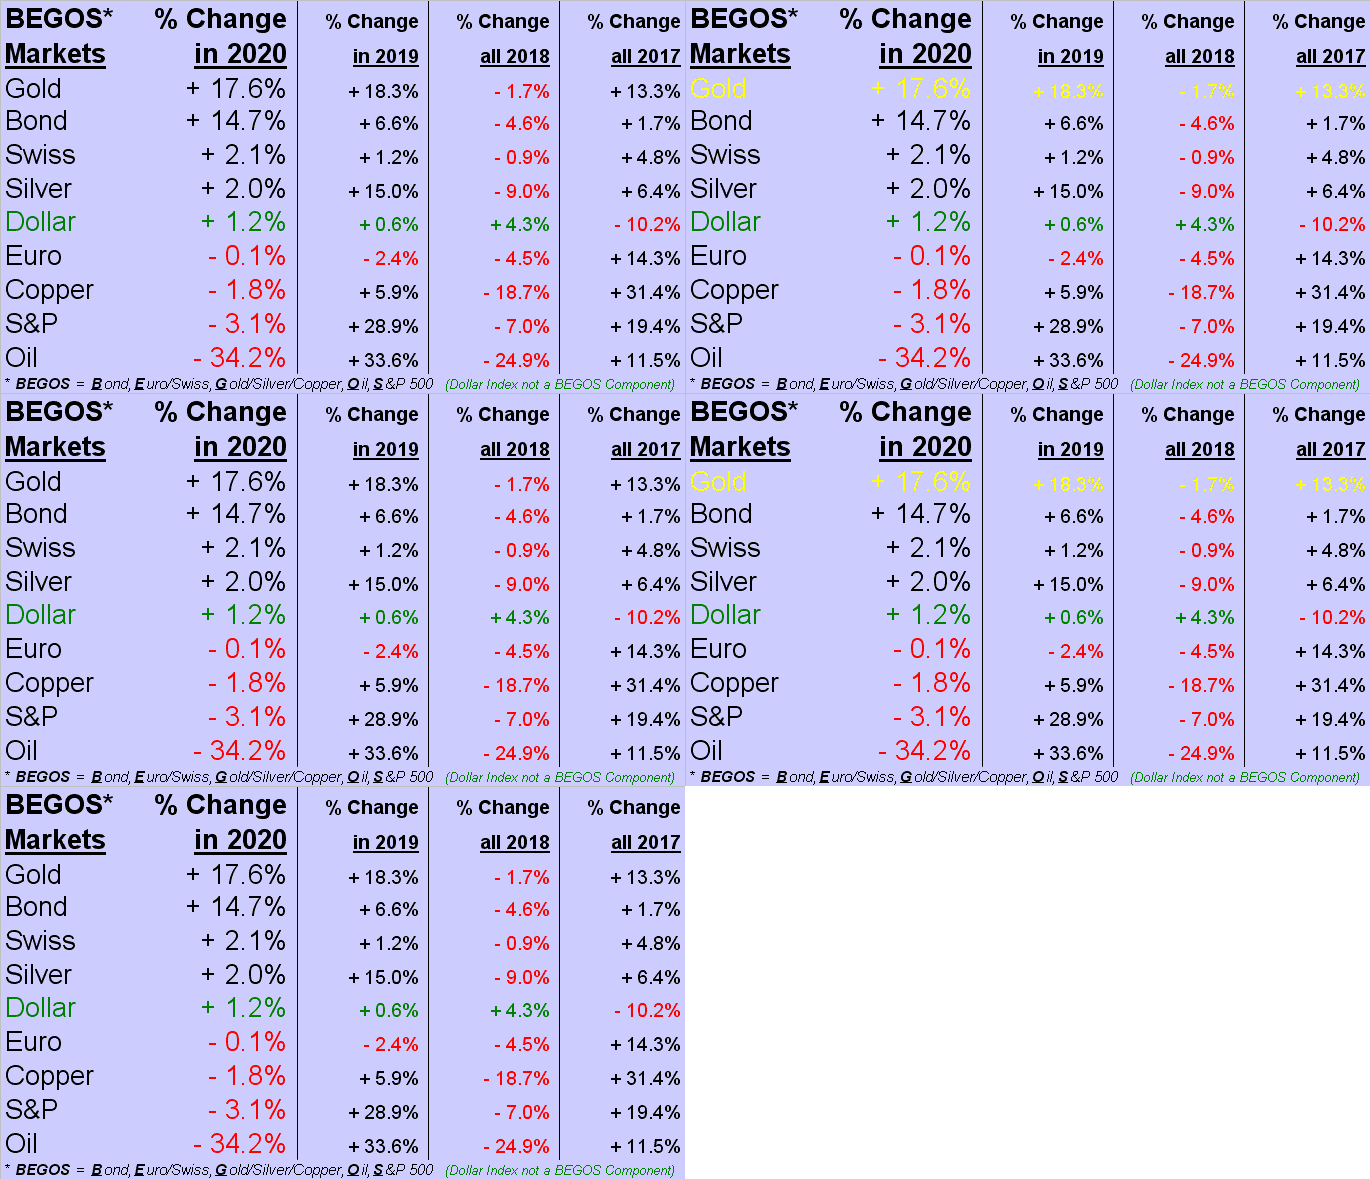
There 'tis, +17.6% to this point in 2020. Perfect Gold vision, that. Annualizing said pace (for those of you scoring at home on a 252-trading-days-per-year basis) suggests price being +34.9% come year-end, at a price of 2050. Or by extrapolating via linear regression thus far, to a price of 2022. Obviously Gold is capable of such an achievement, having in the "Spirit of the 70s" (following Nixon's nixing of the Gold Standard) completed 1972 +43.8%, 1973 +66.7%, 1974 +58.1%, 1978 +36.7%, and 1979 +136.2% ... that's a high percentage. As is the $3,382,157,142,857 added year-to-date to the U.S. Money Supply (M2 measure) a lot of Dollars. Positive Gold Fundamentals infused by the Funny Mentals providing foundationless faux dough for all. "We're in the money, we're in the money..."--[Dance of the Dollars, Dubin/Warren, Gold Diggers of 1933, Warner Bros.]
Still, hardly dancin' in the above Standin's is Sister Silver, only a wee +2.0% in 2020. Like Gold, "I'm money, too!" she says. Quite the sleeper, our Sister Silver, but oh can she go! Recall her net annual change for 2003 of +28.5%; and for 2005 +30.1%; and for 2006 +45.5%; and for 2009 +52.9%; and for 2010 +84.0%? We do.
But for the present, Gold gets top billing as the best BEGOS Markets performer year-to-date, moreover having topped The Northern Front as we next see by the weekly bars going back a full year. Stark therein is all that anticipated resistance brought upon Gold by The Northern Front, until this past Tuesday's break-though. 'Tis a beautiful thing:
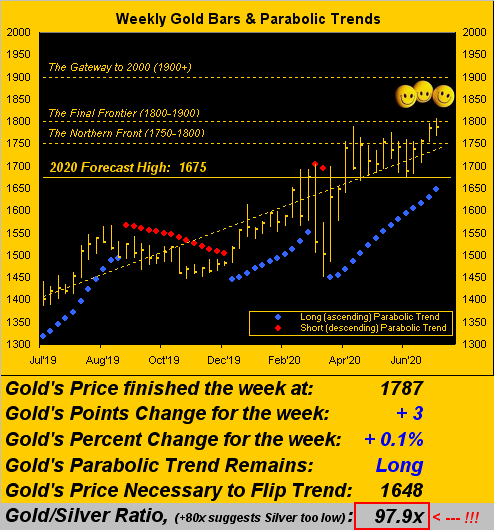
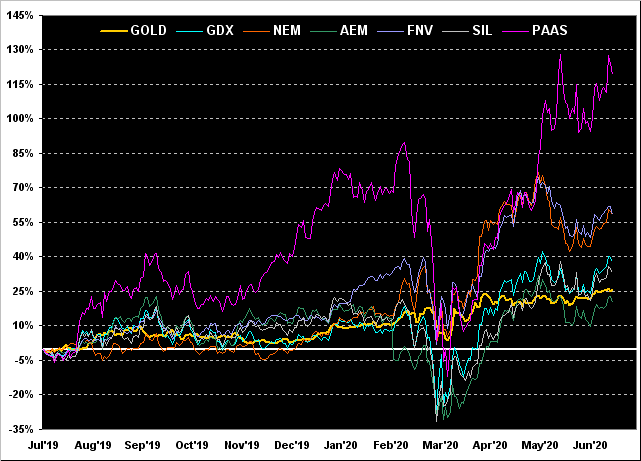
'Course, hardly beautiful at the above graphic's foot is the Gold/Silver ratio of 97.9x, (the millennium-to-date average now 65.9x, by which Silver today rather than being 18.26 would be 48.5% higher at 27.11). But again, oh can she go! To wit, Pan American Silver (NASDAQ:PAAS) from this time a year ago is +119% as we turn to Gold vis-à-vis some of its most visible equities brethren. The balance of the bunch find Newmont (NEM) +59%, Franco-Nevada (FNV) +58%, the VanEck Vectors Gold Miners exchange-traded fund (NYSE:GDX) +38%, the Global X Silver Miners exchange-traded fund (NYSE:SIL)) +33%, Gold itself +26%, and Agnico Eagle Mines (NYSE:AEM) +20%. A few leverage laggards in there, non? Oui...
Not lagging a bit is the recovering Economic Barometer, although the latest robust jobs data was a bit mitigated by a few lurid negatives. To be sure, this past week's fireworks found June's Payrolls far firmer than expected, the Unemployment Rate not nearly as dire as predicted, and the Institute for Supply Management's Manufacturing Index having moved from contraction into expansion; as well, May's Pending Home Sales were wildly better than consensus: "We can't travel, so instead, me 'n Mabel decided to buy that house." (Way to budget there, Bert). But incoming metrics also included an increase in weekly first-time Jobless Claims, a decline in both Hourly Earnings and the Average Workweek during June, and a worsening Trade Deficit for May. On balance, Baro-good, but with now with hitches along the way:
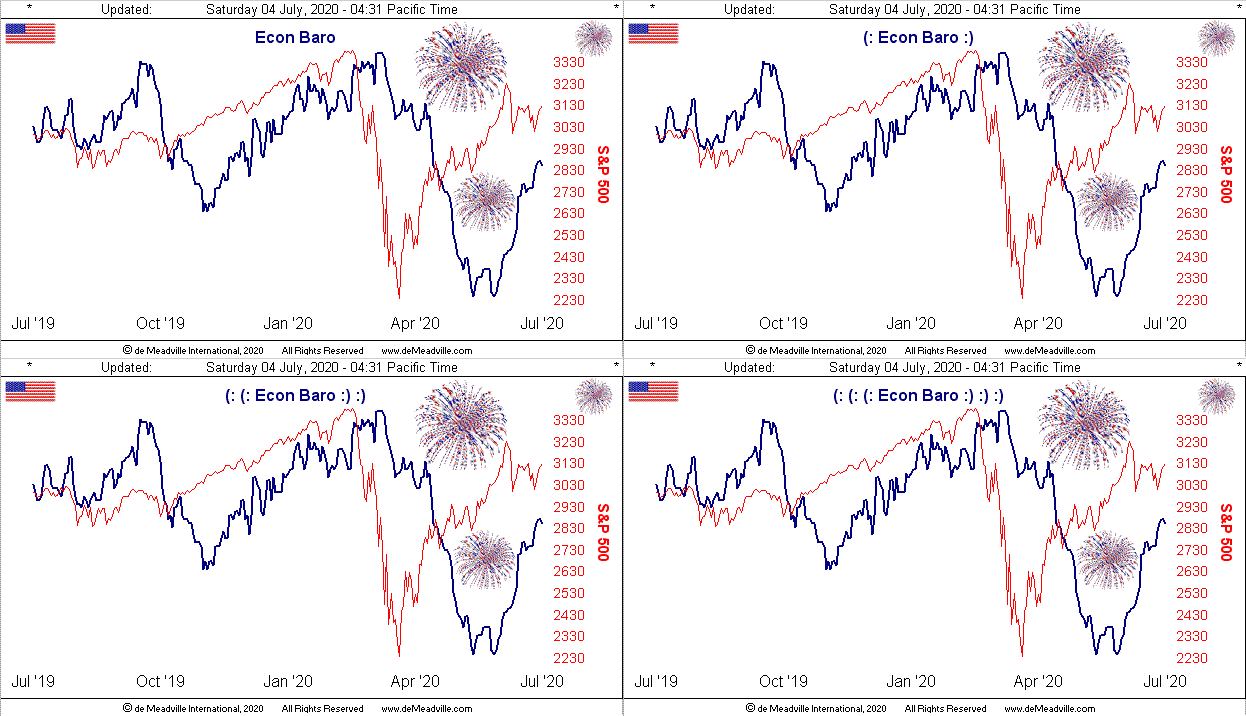
'Course for the stock market (the S&P 500's above red line), a key concern remains -- given an ever-accelerative testing rate -- that more COVID cases are being discovered. (You can't make this stuff up). The good (albeit rather unreported) news is that according to this morning's week-over-week numbers from the European Center for Disease Control, "confirmed COVID-19 deaths" declined in both the U.S. and France. Let that trend be our friend.
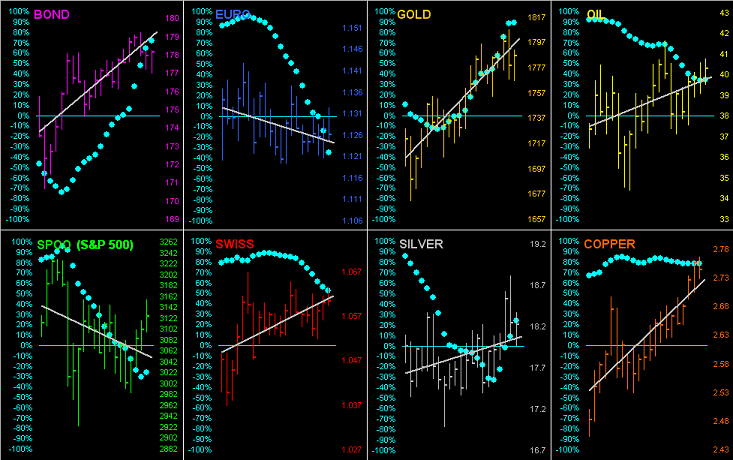
Speaking of trends, let's next go to those of the 21-day linear regression variety by going 'round the horn for all eight components which comprise the BEGOS Markets. As you can see across the respective daily bar plots, only the euro and S&P 500 are sporting negative grey trendlines. However, we're wary of the declining baby blue dots of trend consistency for both the Swiss franc and oil.
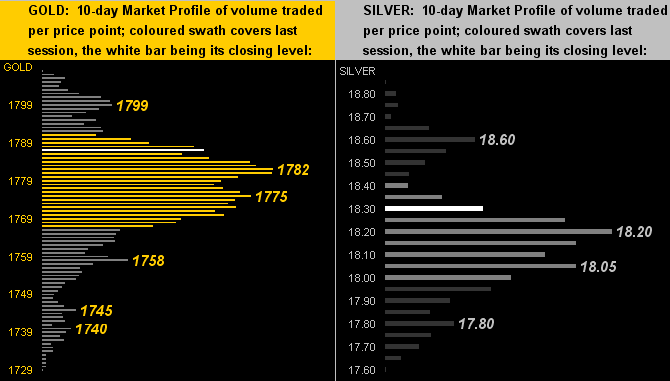
As for the 10-day Market Profiles of the precious metals, similar to what we saw a week ago, the underlying trading support remains intact. For Gold on the left 1782-1775 remains a fairly key level to hold, whilst for Silver on the right 'tis same analysis for the 18.20-18.05 zone:
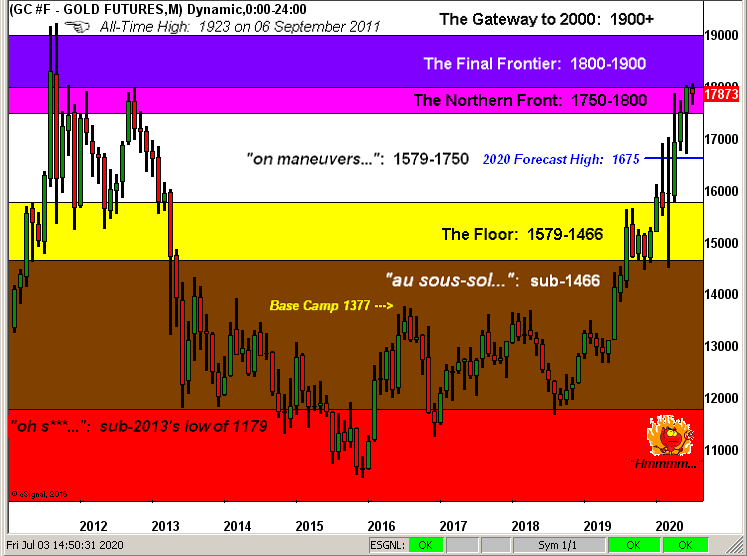
All of which brings us to our monthly view of Gold's Structure from the All-Time High through today. And as we saw above in the weekly bars, those monthly bars below for both June and the start of July show the penetration from The Northern Front across the threshold into The Final Frontier. Again as we've been emphasizing: the resistance was far more formidable for the former than we expect it to be for the latter, which in turn casts doubt for a dive upon the face of the little guy at lower right. Either way, even in adversity given that markets don't progress in a straight line, the critical bit is not to give back The Northern Front:
Next week brings a light load of incoming metrics for the Econ Baro. As well, a peek at the website's Market Ranges page shows have they've materially narrowed from the COVID concern extremes. Thus a lovely time perhaps to take out that Northern Hemisphere summer hammock for a snooze ... foundationally-supported, of course, by Gold!