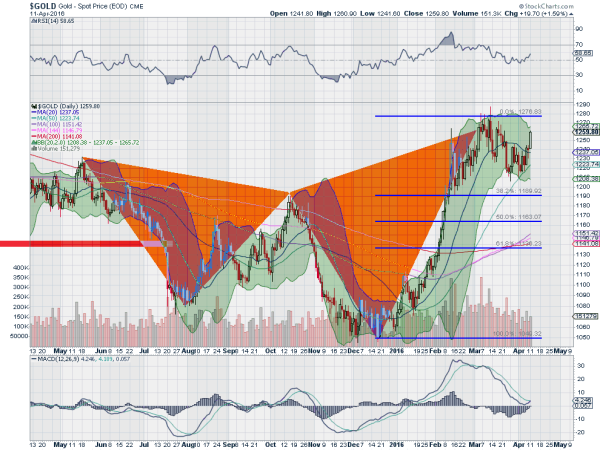
Back on March 22 I wrote about a short term top in gold. There were technical signals pointing to a drop that could break 1200 and even go as low as 1125. The full story is here. The path lower was a slow grind. And subscribers to the Premium content saw I shifted to the upside on Gold over the weekend. Monday’s price action confirmed it with a move higher. So the next logical question for Gold bugs is: How high will it go? Lets take a look.
The chart below gives some clues. First there is the strength of the price action. The retracement of the bearish Shark harmonic did not even make it to 38.2% of the pattern. Strong. Note also that the momentum remained strong. The RSI held over the mid line before reversing back higher Monday and the MACD bottomed and is now about to cross up. That is a buy signal in itself. And finally how the price bounced as it hit the rising 50 day SMA. It had not been in contact with that measure since the uptrend began in January.

So the chart is strong. How high will it go? That is anyone’s guess. But a Measured Move of the initial leg higher would give a price of 1425. Elliott Waver’s would likely look at this as the minimum next wave higher to meet or exceed Wave I. Longer term charts show some possible resistance at 1300 and 1345 as well as 1400 along the way. And a 38.2% retracement of the long run lower from the 2011 high around 1900 comes at 1375. The 38.2% retracement would still be a modest bounce on the longer scale, with 1475 and 1575, the 50% and 61.8% retracements further above. A move to them would be a sign of longer term strength.
The information in this blog post represents my own opinions and does not contain a recommendation for any particular security or investment. I or my affiliates may hold positions or other interests in securities mentioned in the Blog, please see my Disclaimer page for my full disclaimer.
