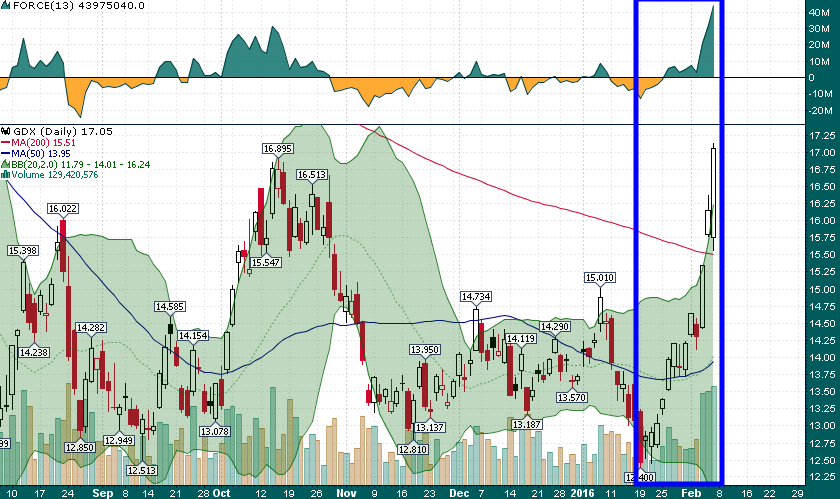
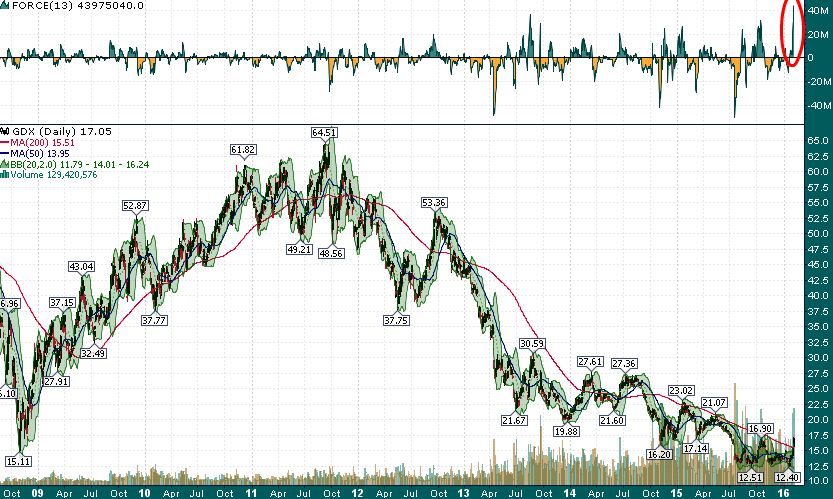
Some stats about the current rally in the gold miners (Market Vectors Gold Miners (N:GDX)):
- +37.50% in 13 trading sessions
- GDX has gone from 3 sessions dipping below the lower 2-std. deviation Bollinger® Band (January 19-21) to 3 consecutive closes above the upper 2-std. deviation Bollinger Band (February 3-5)
- GDX has rallied at least 5% on 120+ million shares for 3 consecutive trading sessions – this has never happened before
- The Force Index (an indicator of buying/selling pressure) for the current rally is literally off the charts
- GDX ended the session on February 2nd roughly 8% below its falling 200-day simple moving average and ended the week on February 5th 10% above its 200-day SMA
While quants will want to backtest any number of factors from the current rally which almost unanimously points to a short setup at Friday’s close, the fact is that nothing like this has ever happened before; We’ve never seen a sector make a marginal new all-time low from a multi-month trading range and then proceed to rally nearly 40% on enormous volume in less than 3 weeks.
So when someone tries to tell you what’s going to happen next with gold and the gold miners, you can simply tell them to save their breath, we’re in uncharted waters.

