Mario Draghi is a hype machine
The gold market is pretty interesting here as investors realized on Thursday that much that comes out of Mario Draghi`s mouth is complete hyperbole, because things aren`t nearly as dire in Europe as some bankers try to persuade for additional stimulus out of the ECB, and Germany isn`t going to sign off on the extreme bazooka stimulus measures because Germans by nature are conservative, and there is a commensurate symmetry between ratcheting up extreme monetary measures and stoking the fire of unintended consequences.
December Rate Hike Fully Priced into Markets
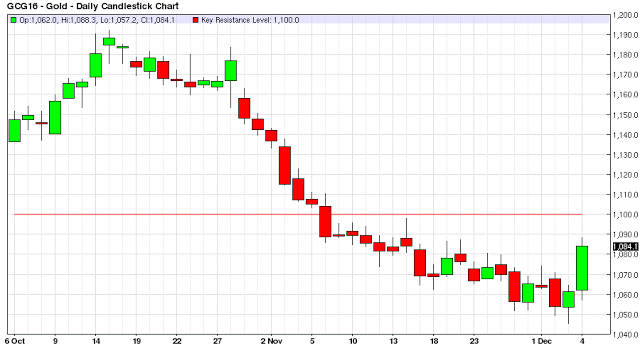
The Federal Reserve is all set to go on with a 25 basis point rate hike in two weeks, the financial markets have priced this in to the tune of around 80%. The surprising tone of the precious and industrial metals price action of Friday in the face of the US dollar strengthening and oil getting hammered on OPEC news was interesting to say the least. The entire complex rallied from Copper, aluminum, platinum, palladium and silver to gold as new money moved into the sector, and stayed there even after Mario Draghi tried to walk back theeuro from Thursday`s currency gains on the US dollar.
Gold Price Action
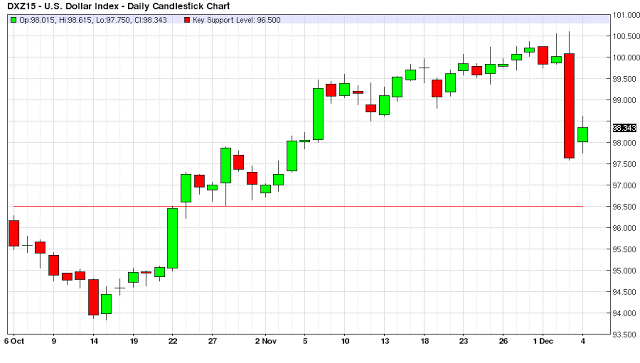
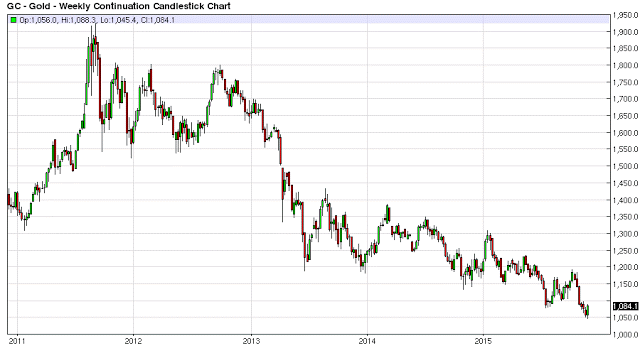
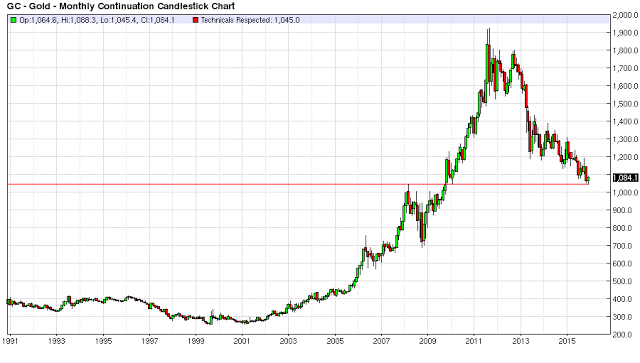
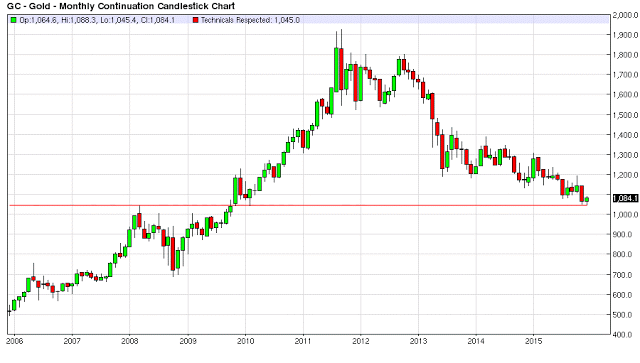
After putting in the low for the year on Thursday morning of $1,045 per troy ounce, gold finished Friday at $1,084 on the February 2016 futures contract. Gold has been hovering right around the $1,060 - $1,070 level for the last two weeks, and even if this is just short covering, somebody forced some shorts to cover. Maybe financial markets and the Metals markets are starting to realize a ‘One and Done’ rate hike by the Federal Reserve isn`t the end of the world. And given the $18 Trillion and climbing in US debt facing central bankers at the Fed they are going to have to be doing a whole lot of “monetizing” or in layman`s terms currency printing for the foreseeable future so gold and other metals look attractive here at multi-year lows.
Follow Through
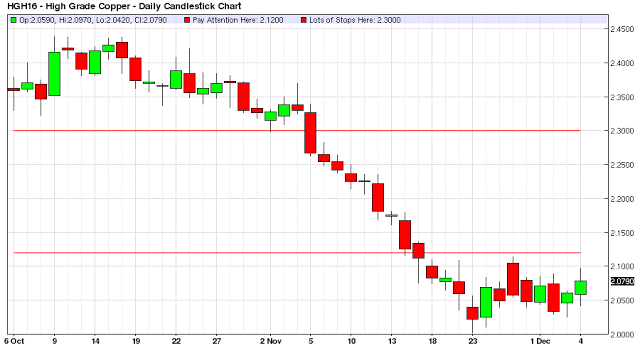
We will see if there is any follow through next week, but copper had its first weekly rise in two months, and China smelters announced production cuts earlier in the week. Several of the other industrial metals showed signs of strength as well for the week. Even though there is a rate hike in two weeks by the Fed, markets often move before the fundamentals. Have the metals markets already priced in the effects of this rate hike on the US dollar; that the Fed is likely to hike but be relatively dovish in hiking so as mitigating any takeoff in the US dollar going forward for the next 3 months?
Crowded Trade – Portfolio Repositioning
Is this long the US dollar, short the Industrial and Precious Metals trade losing steam, or is this just some short covering ahead of the Federal Reserve meeting hoping to avoid the similar fate of Euro Shorts on the morning of the ECB Policy Announcement? Best to take some profits on this trade before the actual event.
It will be interesting how gold trades next week, and for the remainder of the year; but it and many of the industrial metals look like longer term buys at these prices from an investment standpoint.
$1,100 Level in gold
Consequently watch the $1,100 level in gold, if gold breaks above this mark things could get interesting again for the shorts, as many who took this ride down from the $1,190 level probably want to avoid giving back much more profits on this trade, and have lots of stops placed accordingly at this key resistance level of $1,100.
Dovish Fed Speak
If the US dollar tanks on the Fed announcement and press conference look for gold to test the $1,190 resistance level with a huge couple of days of major short covering, and new longs pressing the trade from the long side just based upon the momentum Algos smashing the US dollar and buying gold futures as part of the same programmed trade. The type of day where Gold futures are up $45 one day, $27 the next and voila “let`s see where overhead resistance lies into year-end squaring of positions”?
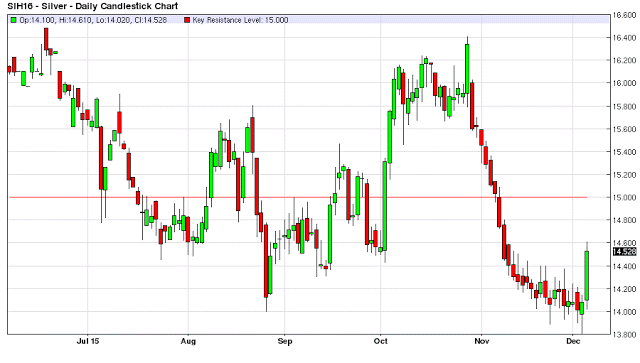
Silver Market Leading Indicator of Money Flows
2016 will be interesting for the price of gold to say the least, but let`s not get ahead of ourselves, there are still 4 weeks left in 2015. And for some reason traders didn`t feel like pressing those gold shorts at $1,045. They couldn`t even hold gold below the $1,060 level which obviously some traders tried to accomplish and failed miserably with how gold ended the week trading all the way back to $1,088 before some profit taking ensued into the close.
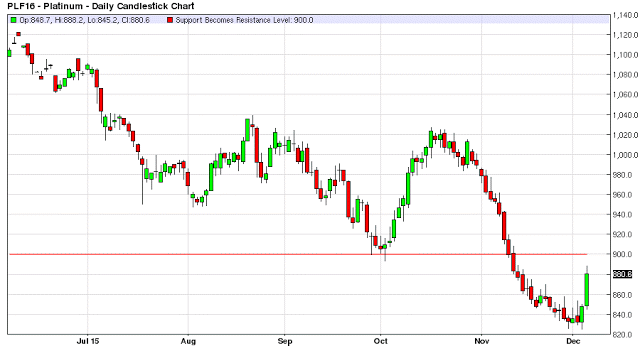
Moreover, this happened when the euro weakened and the US dollar index was up +0.73% on Friday. Therefore pay attention to any follow through for gold and the other metals next week. But the price action on Friday piqued my interest, especially in gold and silver; as I expected some of the Industrial Metals to climb with the production cut announcements. But gold and silver I figured were dead in the water until the Fed announcement on December 16th and they both showed signs of life from the long side on Friday.

