
Some readers may be sick of seeing this chart but I believe there is no more important chart when assessing or describing the current market (in gold stocks). From a weekly price perspective the recent bear market labeled E finished down 65%. It was almost identical in trajectory, time and price to C, the 1968-1970 bear market and fairly close to D, the 1974-1976 bear market. Both of those bear markets were followed by tremendous advances, which took the 1960-1980 secular bull market to new all-time highs. Simply put, by itself this almost bulletproof evidence of a major bottom and likelihood of major gains directly ahead.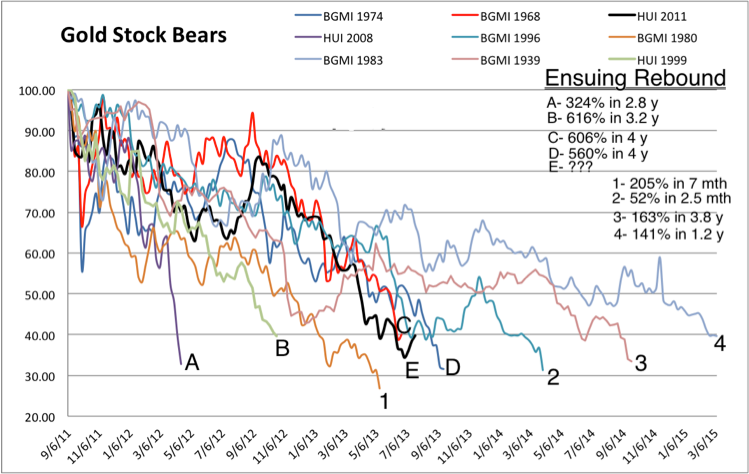
GDX bottomed at $22, which was a very strong Fibonacci target. The target was connected to the 2011 top and the 2012 top, which also marked the start of the breakdown in the spring. When GDX reached this target it formed a bullish hammer and on record volume. That was followed by two weeks of testing the low. Since then the market has moved higher, thus confirming the reversal and the bottom.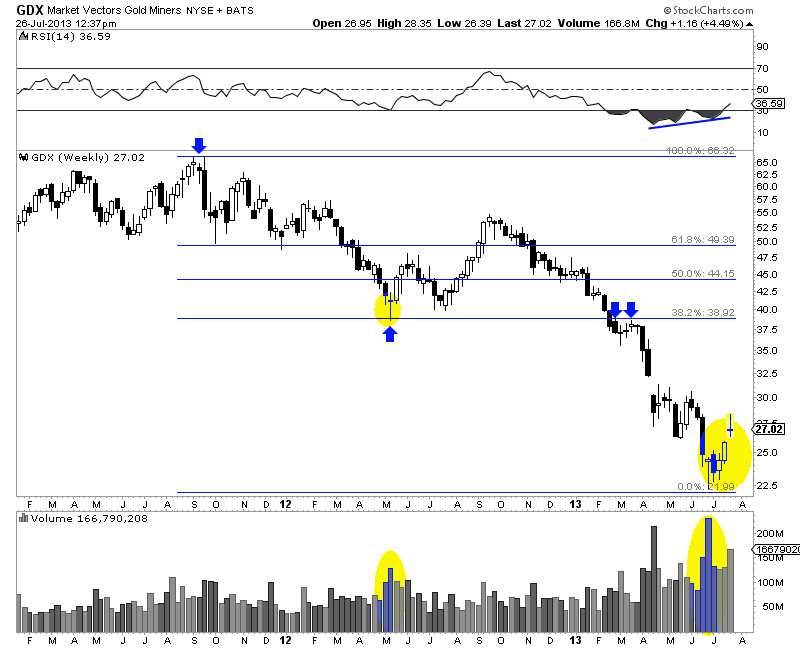
Now that a major bottom is likely in, we should turn our attention to what history tells us about major recoveries. Below is a chart we constructed by using the data from recoveries in 1970, 1976, 2000 and 2008. We weighed those recoveries equally, combined them into one and put the result on a chart with 216 (HUI weekly bottom) as the starting spot. The result is below.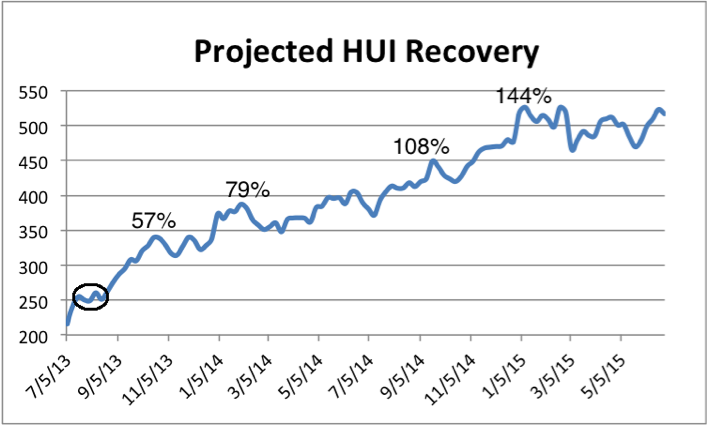
The recovery template, as we call it, argues for a 57% rebound in about four months and a 79% rebound in seven months. Yet, notice the circle at the start? There is where the recovery corrects or consolidates around the 50-day moving average. Those who missed the initial pop could use the correction or consolidation to capitalize on the next and much larger leg higher. The bottom line is if we do see a correction or consolidation, don’t let it frighten you or cause you to question the major bottom. History argues that it is an excellent buying opportunity. Again, use the 50-day MA as your guide. The market can begin its next leg higher when it is trading above a 50-day MA that has started to curl up.
- English (UK)
- English (India)
- English (Canada)
- English (Australia)
- English (South Africa)
- English (Philippines)
- English (Nigeria)
- Deutsch
- Español (España)
- Español (México)
- Français
- Italiano
- Nederlands
- Português (Portugal)
- Polski
- Português (Brasil)
- Русский
- Türkçe
- العربية
- Ελληνικά
- Svenska
- Suomi
- עברית
- 日本語
- 한국어
- 简体中文
- 繁體中文
- Bahasa Indonesia
- Bahasa Melayu
- ไทย
- Tiếng Việt
- हिंदी
The Gold Chart That Signaled The Bottom
Published 07/26/2013, 01:45 PM
Updated 07/09/2023, 06:31 AM
The Gold Chart That Signaled The Bottom
Latest comments
Loading next article…
Install Our App
Risk Disclosure: Trading in financial instruments and/or cryptocurrencies involves high risks including the risk of losing some, or all, of your investment amount, and may not be suitable for all investors. Prices of cryptocurrencies are extremely volatile and may be affected by external factors such as financial, regulatory or political events. Trading on margin increases the financial risks.
Before deciding to trade in financial instrument or cryptocurrencies you should be fully informed of the risks and costs associated with trading the financial markets, carefully consider your investment objectives, level of experience, and risk appetite, and seek professional advice where needed.
Fusion Media would like to remind you that the data contained in this website is not necessarily real-time nor accurate. The data and prices on the website are not necessarily provided by any market or exchange, but may be provided by market makers, and so prices may not be accurate and may differ from the actual price at any given market, meaning prices are indicative and not appropriate for trading purposes. Fusion Media and any provider of the data contained in this website will not accept liability for any loss or damage as a result of your trading, or your reliance on the information contained within this website.
It is prohibited to use, store, reproduce, display, modify, transmit or distribute the data contained in this website without the explicit prior written permission of Fusion Media and/or the data provider. All intellectual property rights are reserved by the providers and/or the exchange providing the data contained in this website.
Fusion Media may be compensated by the advertisers that appear on the website, based on your interaction with the advertisements or advertisers.
© 2007-2025 - Fusion Media Limited. All Rights Reserved.