Return of risk premium Bonds were rallying on Wednesday, but there was a huge reaction in the opposite direction on Thursday in several markets. Lower-than-expected Q1 GDP growth figures for some of the peripheral European countries reminded people that a) the debt-to-GDP ratio of these countries is not necessarily improving, and b) peripheral Eurozone bonds at current levels have almost no risk premium built into them. In the shorter end of the market (5 years) Ireland was borrowing at lower rates than the UK and Spain at lower than the US! (albeit in different currencies). As I pointed out in an article for the CNBC web site (”New Greek bond says more about Germany than Greece,” 11 April, http://www.cnbc.com/id/101574949 ), if a country’s interest rate is higher than its growth rate, then the debt burden will grow as a percent of GDP. The country will have to run an ever-higher primary budget surplus in order to prevent the debt from snowballing. Apparently investors suddenly realized that this is still the case for the peripheral countries. Spain may have shown an acceleration in growth in Q1 but Portugal’s economy shrank 0.7% qoq and even several “core” countries did badly (Netherlands in particular with -1.4% qoq). This put a risk premium back into peripheral bonds and yields for some countries jumped nearly 20 bps. Bund yields on the other hand fell 6 bps in a flight to quality.
The risk premium returned in currencies as well and USD gained against most of the EM currencies that we track. TRY/USD was the big loser as labor unions in Turkey went on strike to protest the mining disaster. USD/HUF, ZAR/USD and BRL/USD were not far behind. The regional diversity of the losers shows that this is not necessarily contagion or due to Ukraine fears but rather is related to the specifics problems of each country. HUF for example fell after a statute was published that made it a legal obligation for the Hungarian central bank to support the government’s economic policies. The only EM currency to make a notable gain vs USD was USD/INR, which rallied as the results of the vote started to come in and it appears that the BJP coalition is leading. Indian stocks jumped the most in five years on the news as well. I would be cautious about carry trades for the time being although with US 10-year yields now below 2.5%, probably greed will begin to outweigh fear again in a few days and investors will start to venture out again.
As for the G10 currencies, USD was higher against most except for USD/JPY, which had a safe-haven bid to it. I think it’s significant that the dollar gained against most currencies on a risk-off day and with US interest rates falling. I think this shows confidence coming back to the US economy as US indicators are improving, and confidence coming back into the USD as a result. We may finally be seeing the start of the long-awaited (by me, at least) USD rally.
Fed Chair Janet Yellen spoke to the US Chamber of Commerce and the US Small Business Administration but made no new revelations about Fed policy.
The European day is relatively light as no major affecting news are coming out. In Europe, we only get Eurozone’s trade balance for March. The bloc’s trade surplus is forecast to have risen to EUR 16bn from EUR 13.6bn.
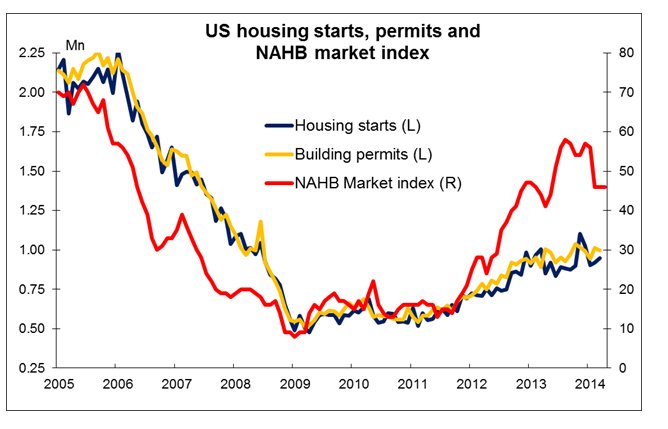
In the US, both the housing starts and building permits are forecast to have improved in April, while the University of Michigan preliminary consumer sentiment for May is estimated to rise to 84.5 from 84.1. More good US economic news, particularly about the housing market, would probably help the dollar to rally further, in my view.
Two more speakers follow Chair Yellen on Friday. The ECB Executive Member Benoit Coeure speaks at a conference, while the St. Luis Fed President James Bullard gives a presentation on the economy and monetary policy to the Arkansas Bankers Association.
The Market
EUR/USD rebounds from 1.3650
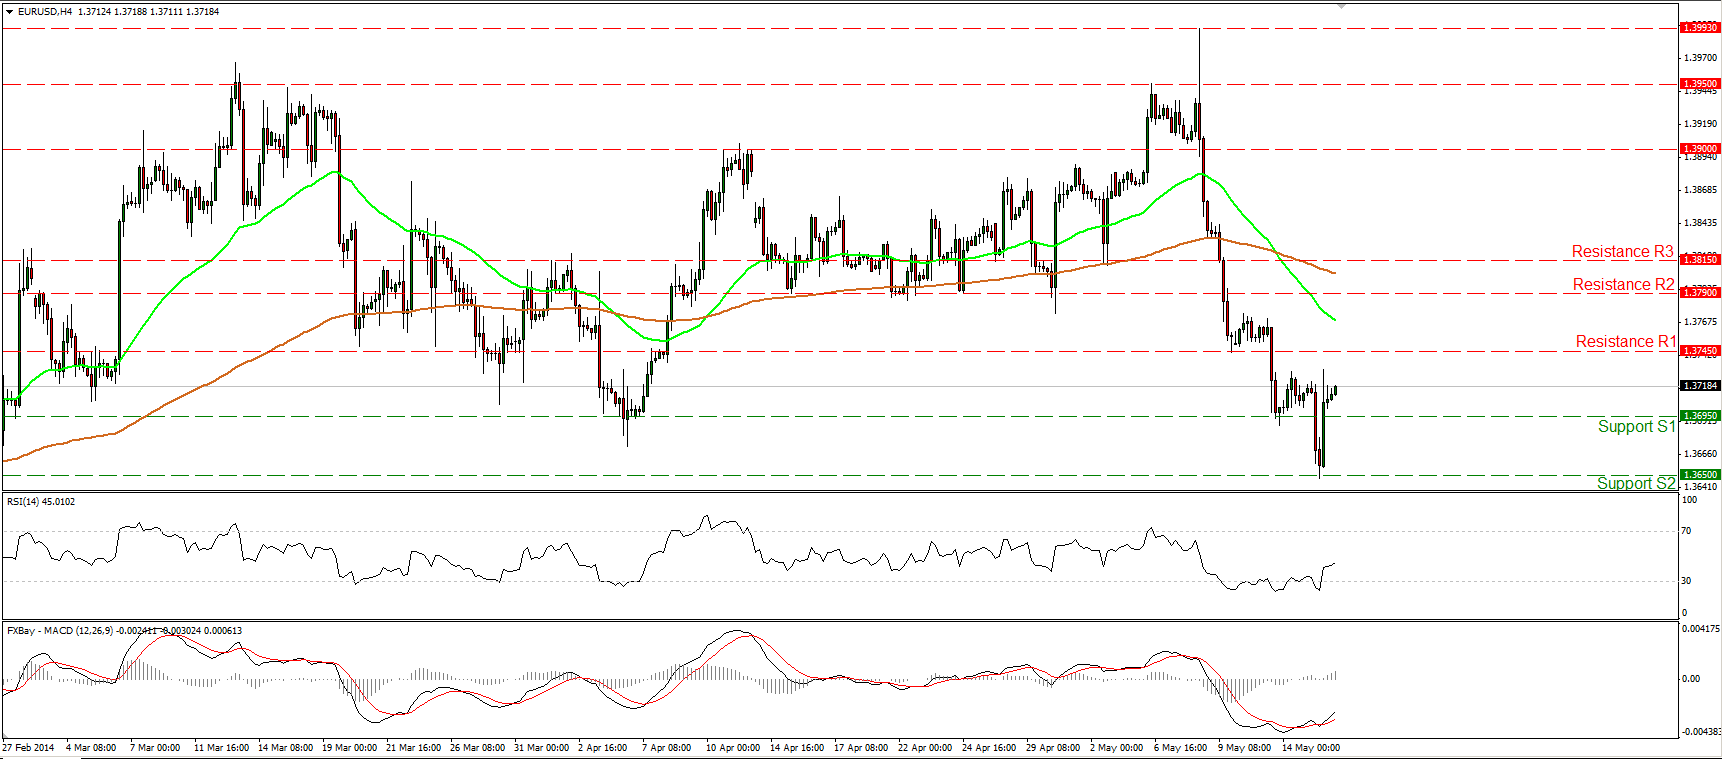
EUR/USD fell below the 1.3695 hurdle on Thursday morning and reached our next barrier at 1.3650 (S2). However, the pair rebounded later in the day to trade again above 1.3695 (S1). Considering that the RSI moved higher after exiting oversold conditions, and that the MACD, although in its bearish territory, lies above its signal line, I would not rule out the continuation of the upside wave, maybe for a challenge near the 1.3745 (R1) zone. Nonetheless, I still consider the overall short-term outlook to be to the downside and yesterday’s advance to be a corrective wave. As a result, I would expect the bears to take control in the near future targeting once again the 1.3650 (S2) support level.
• Support: 1.3695 (S1), 1.3650 (S2), 1.3600 (S3).
• Resistance: 1.3745 (R1), 1.3790 (R2), 1.3815 (R3).
Is EUR/JPY ready for another dip?
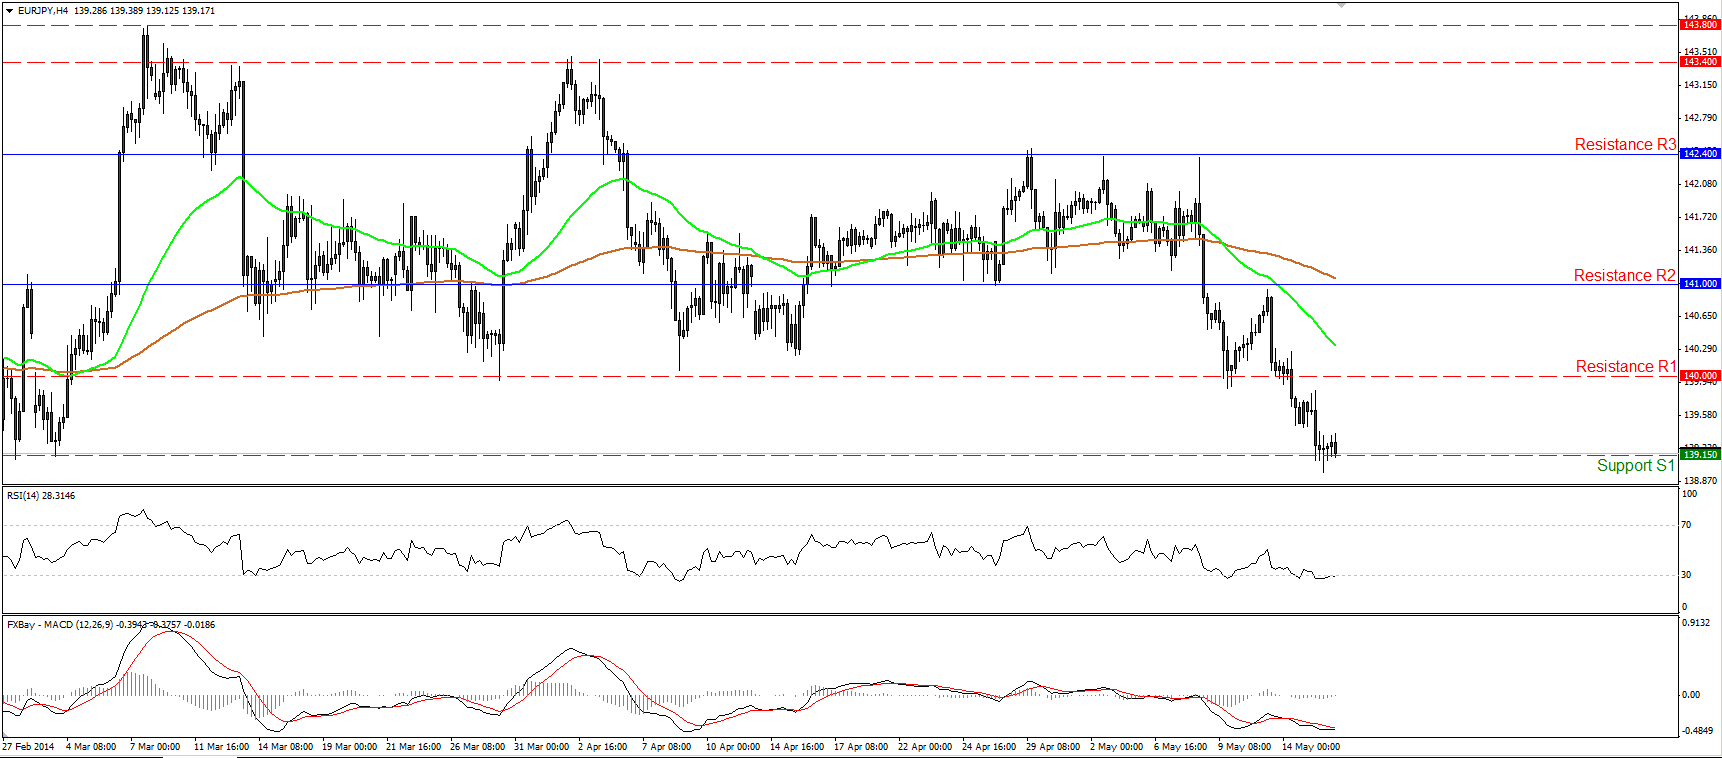
EUR/JPY fell below the psychological barrier of 140.00 and moved lower to meet our next support at 139.15 (S1). As long as the rate is printing lower lows and lower highs below both the moving average I see a negative picture. A clear dip below the 139.15 (S1) support could pave the way towards the hurdle of 137.55 (S2). On the daily chart, the daily MACD, left its neutral line and obtained a negative sign, confirming the recent bearish momentum of the pair and favoring the continuation of the decline.
• Support: 139.15 (S1), 137.55 (S2), 136.20 (S3).
• Resistance: 140.00 (R1), 141.00 (R2), 142.40 (R3).
GBP/USD remains mixed
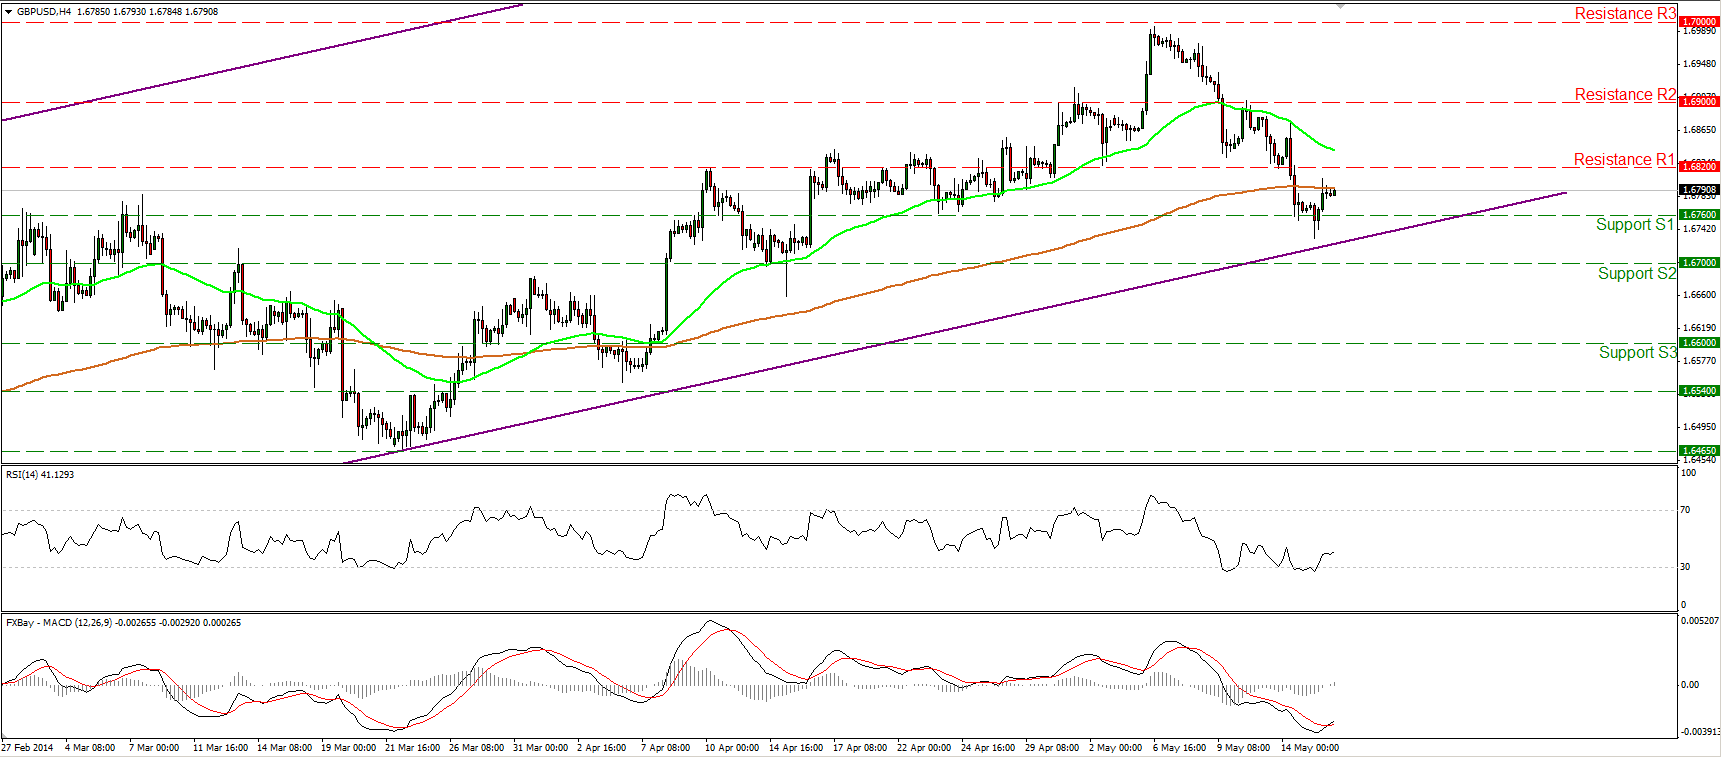
GBP/USD fell below the 1.6820 barrier and moved lower to find support near the 1.6760 (S1) barrier, slightly above the lower boundary of the longer-term upward sloping channel, connecting the highs and the lows on the daily chart. The rate remains within the aforementioned channel, keeping the long-term uptrend intact, but if this week closes lower than Monday’s opening level, it will confirm the shooting star identified on the weekly chart and could trigger further declines. As a result, I would maintain my neutral view on the overall picture of the pair. Coming back to the 4-hour chart, the RSI rebounded from its 30 level, while the MACD, although in its negative territory, crossed above its trigger line, favoring an upside move for now.
• Support: 1.6760 (S1), 1.6700 (S2), 1.6600 (S3).
• Resistance: 1.6820 (R1), 1.6900 (R2), 1.7000 (R3).
Gold not choosing a direction
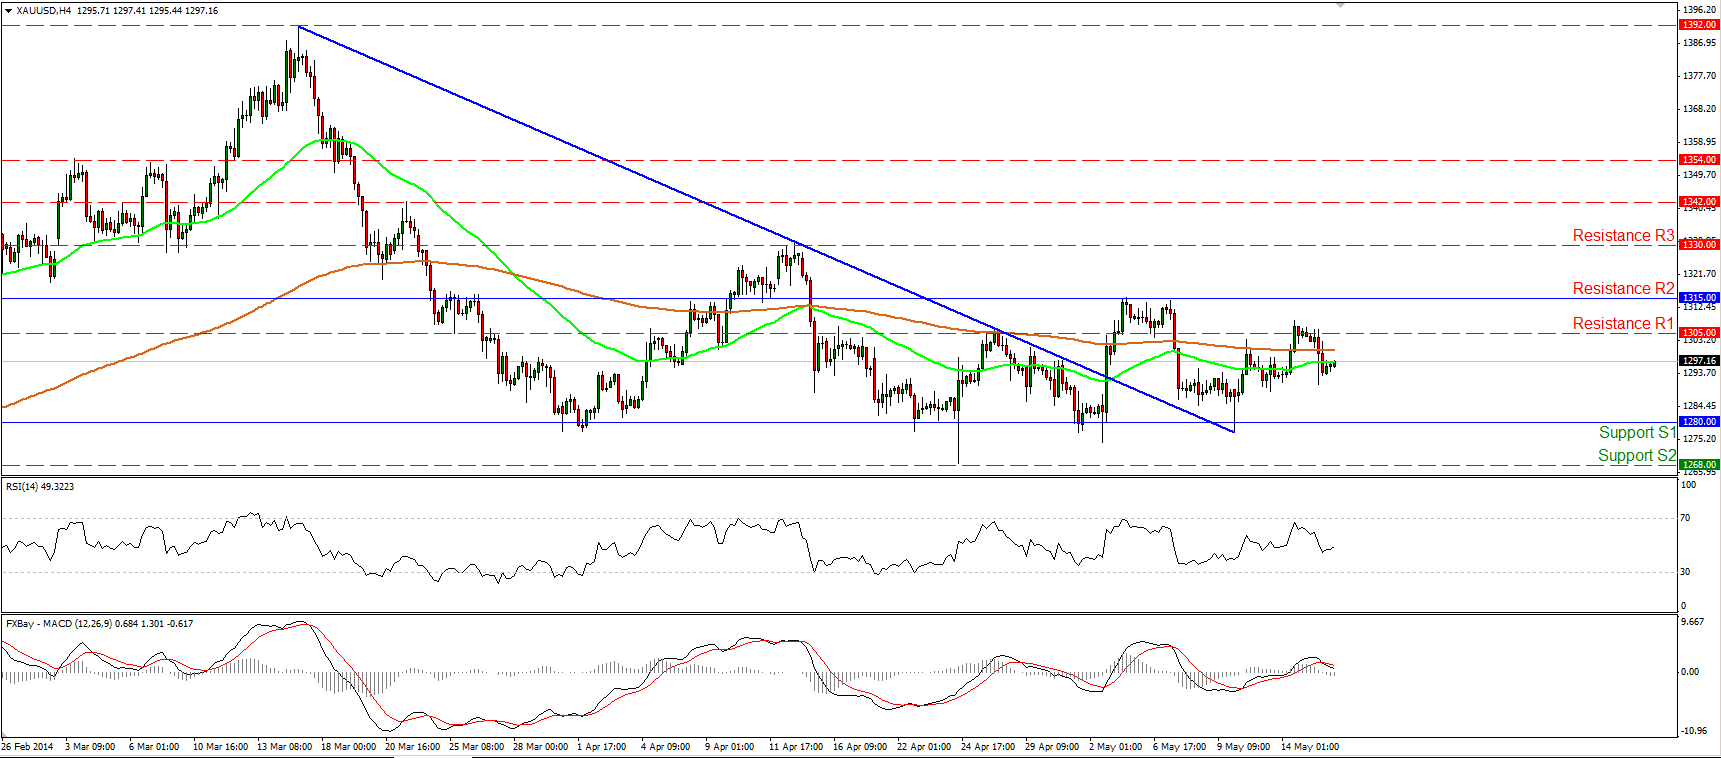
Gold failed to maintain above 1300 and moved once again lower. The precious metal seems to prefer a sideways path between the support of 1280 (S1) and the resistance of 1315 (R2). Both our moving averages are pointing sideways, while both the daily MACD and the daily RSI lie near their neutral levels, confirming the trendless picture of the yellow metal. A break above 1315 (R2) is needed to turn the picture positive and could target the resistance of 1330 (R3), while a dip below 1280 (S1) may see the support of 1268 (S2).
• Support: 1280 (S1), 1268 (S2), 1250 (S3).
• Resistance: 1305 (R1), 1315 (R2), 1330 (R3).
Crude Oil pulls back
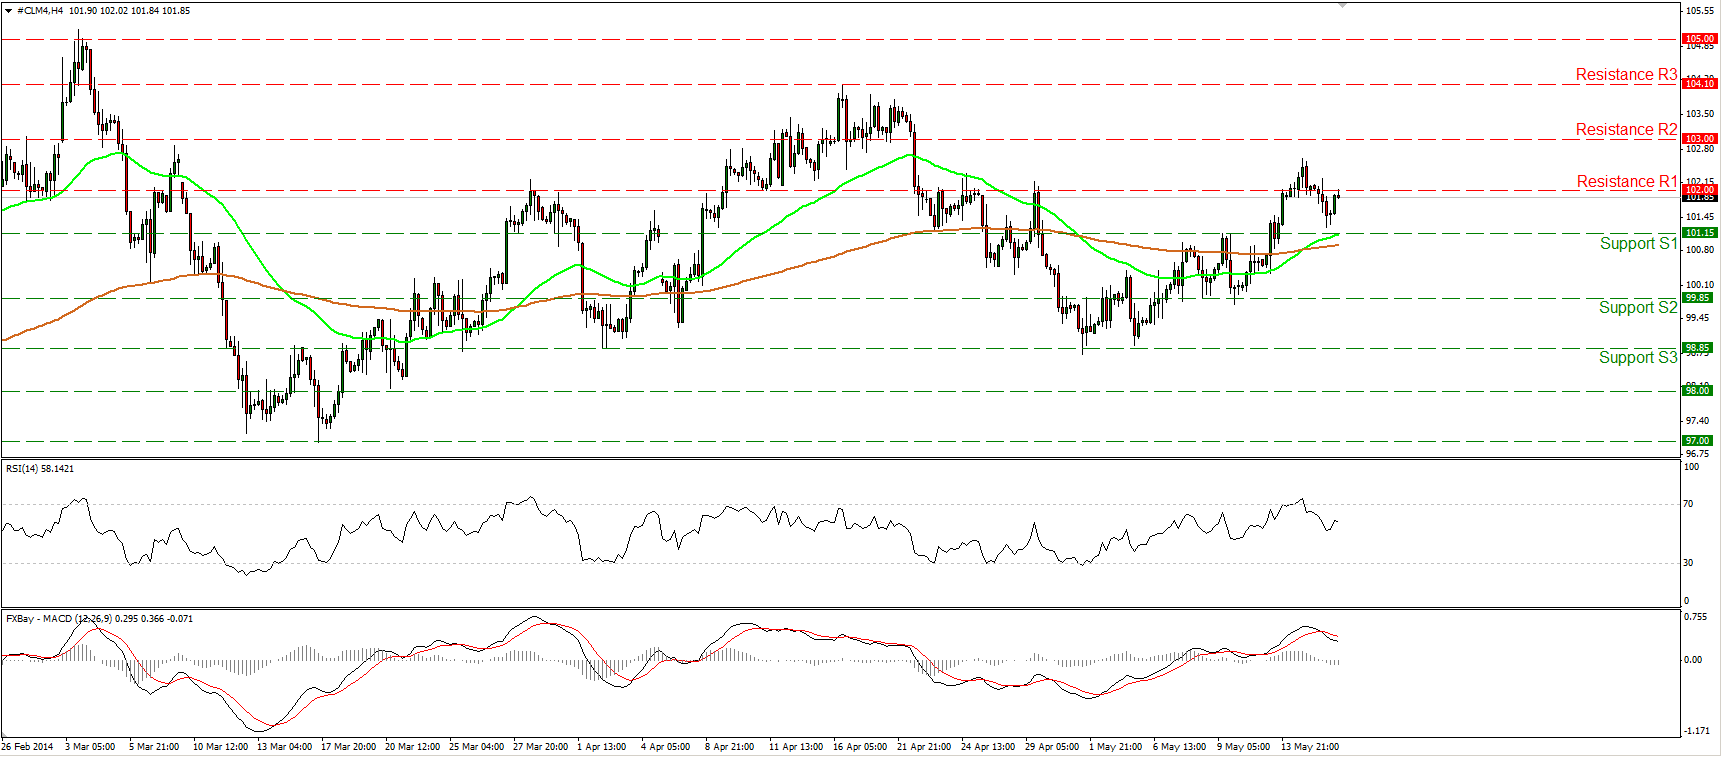
WTI pulled back to trade once again below 102.00 but met support slightly above the 101.15 (S1) bar and is back for another challenge near the hurdle of 102.00 (R1). As long as WTI is printing higher highs and higher lows above both the moving averages, the uptrend remains intact. However, since both our momentum studies are still declining, with the MACD remaining below its trigger line, I would adopt a neutral stance for now until we have clearer indications about whether the uptrend is likely to continue.
• Support: 101.15 (S1), 99.85 (S2), 98.85 (S3).
• Resistance: 102.00 (R1), 103.00 (R2), 104.00 (R3).

