Remember 2014 when the Fed said that it would need to start thinking about removing stimulus? I know, I know, I cant remember dinner last night either. But when that happened there was a flood of analysts and strategists that proclaimed the death of the 30-year bond market rally and that it was time to sell Treasury bonds in 2015.
What happened? Bond prices continued to move higher. Huh? Yes the strategists were wrong. Well they said they were early, and renewed the call for higher rates and lower prices in 2016. This time they would be correct.
Well not really. Bond prices continued to drift higher, or at least not fall, for the next 7 months. It was not until late into the summer, and after the Fed had already gone from removing accommodation to adding one interest rate hike that bond prices started to fall.
So the strategists and analysts were only off by 2 years. Don’t worry they will claim victory. The move lower in prices and higher in yields accelerated after the election. But then in December that move stalled. So what is next? Shall we ask the strategists? How about just looking at the price action to see (via the 5-year yield index).

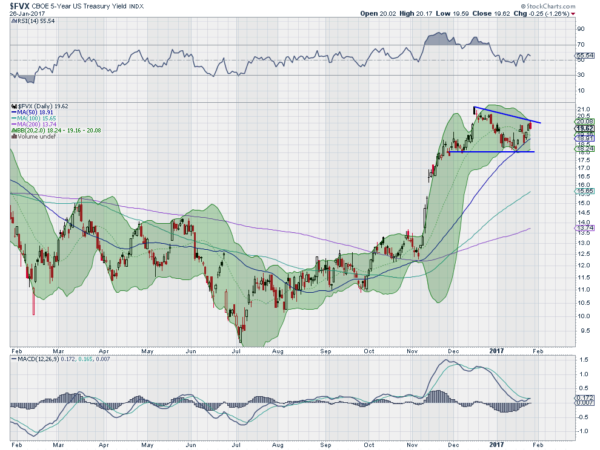
The chart above shows that the initial rise in yields beginning in the summer and accelerating in November, this time for the 5-Yr Treasury note. After running the first 9 months of the year under its 200 day SMA it moved above it in October. It fell back to retest the 200 day SMA before the election and then launched higher. it has now established a base rate at 1.8% as support, 40-50 basis points above the earlier part of the year.
The consolidation in the form of a descending triangle and re-connection with the 50 day SMA suggest that the run higher is not over. And a move out of this pattern to the upside would look for a run to about 2.60. The RSI has held in the bullish range, supporting a move to higher rates and the MACD is about to cross up. With the yield of the 5-year note at the top of the triangle it is time to watch for a possible break higher.
But this is about interest rates not interest rate. What is interesting is that you see the same chart forming in both the 10-year note and the 30-year bond. The 10-year has a new base at 2.30% and target of 3.15% on a break higher. The 30-year bond's base is between 2.90% and 2.95% and the upside target is to 3.50-3.55%. The point, all rates look set up to move higher.
Disclosure: The information in this blog post represents my own opinions and does not contain a recommendation for any particular security or investment. I or my affiliates may hold positions or other interests in securities mentioned in the Blog, please see my Disclaimer page for my full disclaimer.
