My Premium Members are accustomed to, and enjoy, my regular accurate weekly updates on Bitcoin (BTC) and its related indices/charts: The Bitcoin Investment Trust (OTC:GBTC) and the NYSE Bitcoin Index (NYXBT).
Meanwhile if you read the news and other outlets you can get easily and utterly confused. Some predict BTC to reach $65,000 to $225,000 (see here) others are calling for it to go to zero (see here). Quite the margin of error I must admit. So what will it be? $225,000 or $0.00? The answers we seek are ALWAYS in the price charts we trade and analyse. So let's get right to it, shall we!?
What I will do here is use a weight of the evidence approach by analyzing BTC's chart and it's related GBT and NYXBT charts. The latter two will give us valuable additional insights the BTC chart alone can or may not provide us.
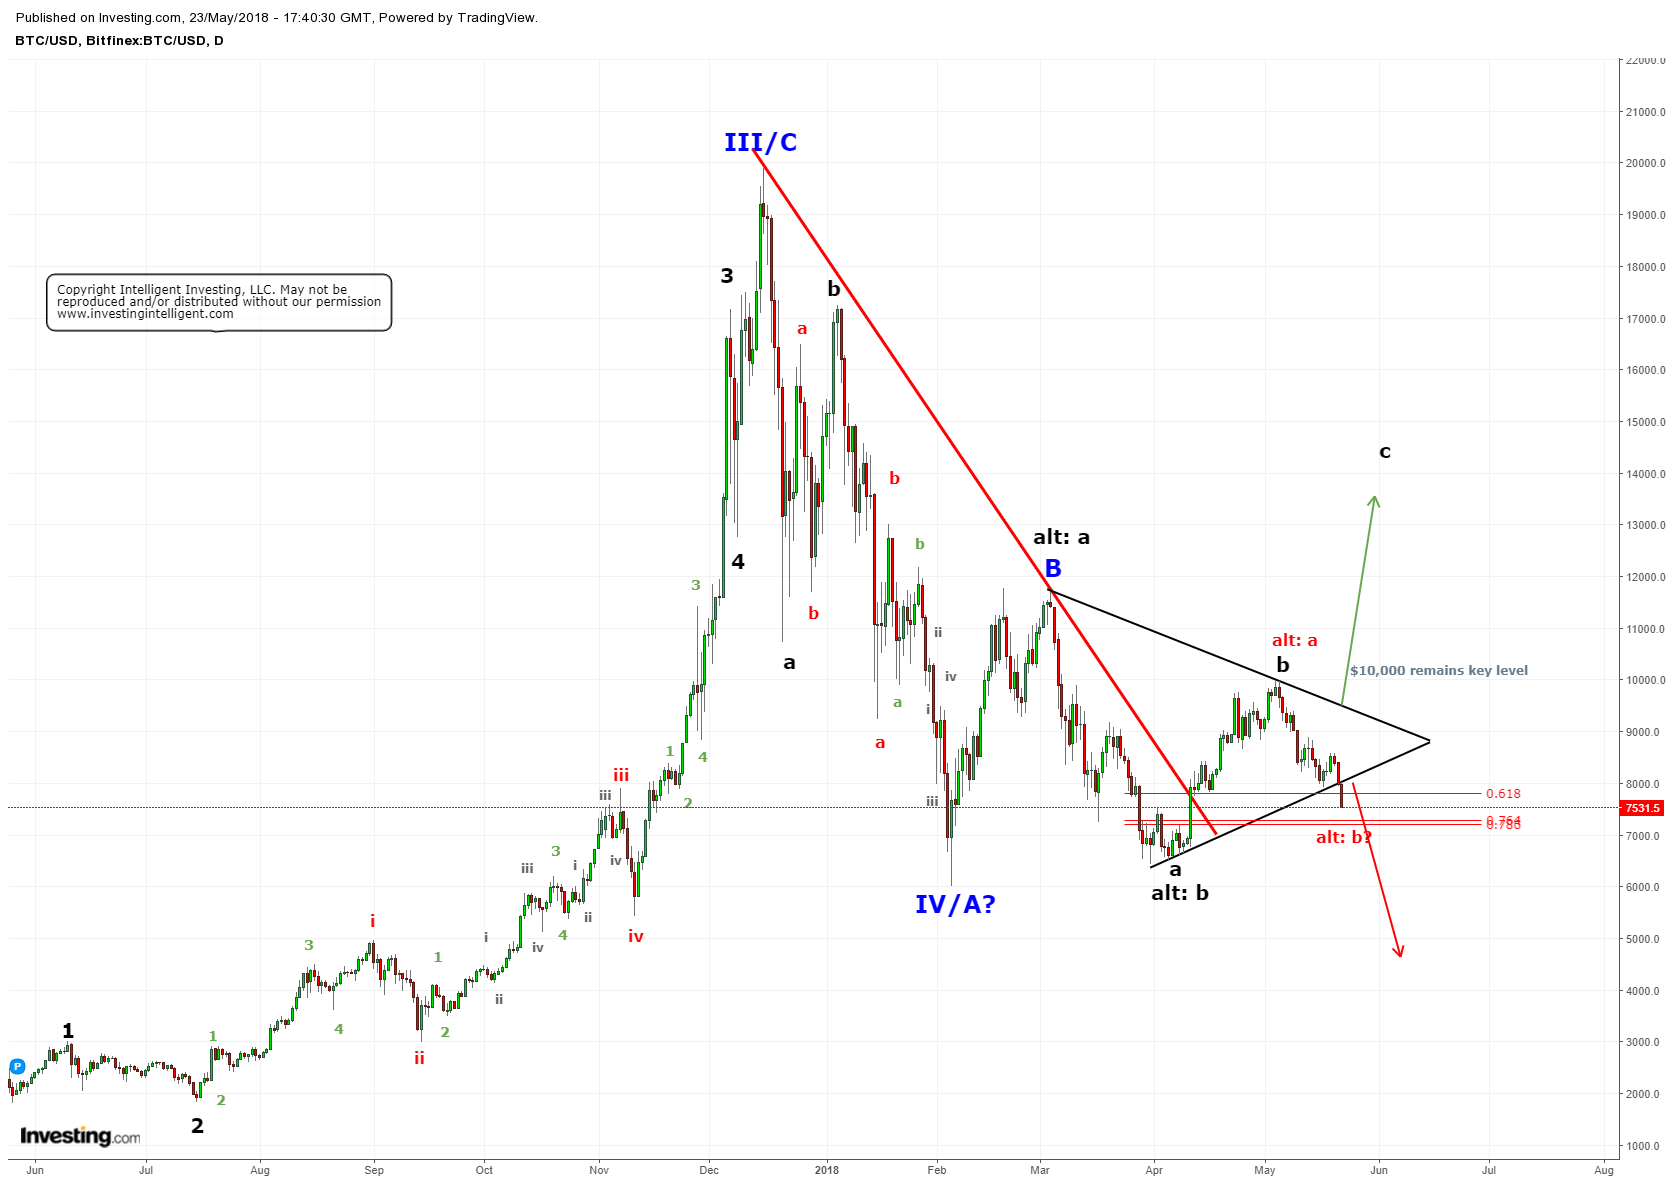
Using Elliot Wave Theory (EWT), BTC topped after a 3-wave advance on December, 16, 2017 at $19,891. Since then it's been downhill from there with the occasional multi-day to multi-week rally, but lower lows and lower highs it is. (For the rest of the EWT-count before June 2017, see attached PDF-file). As usual with EWT, it finds the possible paths the market can chose to take. Eventually we'll know which one it will ultimately be by using if/then scenarios.

- The Bulls would really like to see the February low as a wave-4 (blue IV) low, which will mean a wave-5 (V) to new All Time Highs (ATHs) is now underway. Given how price has behaved since that low and is currently behaving - breaking down, not above $10,000, etc) I find this for now a low probability possibility: 20%. I've therefore not annotated this possibility on the chart as there's nothing yet to strongly suggest this is the case (see also item #2).
- The Bulls' 2nd favorite, albeit only intermediate-term, is a larger (blue) B-wave developing, which is subdividing into three (black) a,b,c waves, with the c-wave now underway (green arrow), and which is subdividing into an additional 3-waves (red a,b,c). For this count, aka possibility, to remain valid, BTC should not drop below the 78.6% retrace at $7210 of the prior April to May advance and it must eventually break above $10,000. It's got some ways to go to say the least. Hence, I find this option somewhat more likely than the first possibility: 30%. If that $7210 level breaks, however, the directly Bearish option comes into play: see next bullet. Here's you "if/then scenario" :-)
- The Bears favorite is that the larger (blue) B-wave already peaked and now a larger C-wave to new lows is underway. The fact that price already broke down below the lower black uptrend line in place since early-April speaks in favor of this EWT count/option: 50%.
The next two charts will shed some more light on the above options with additional detailed information.
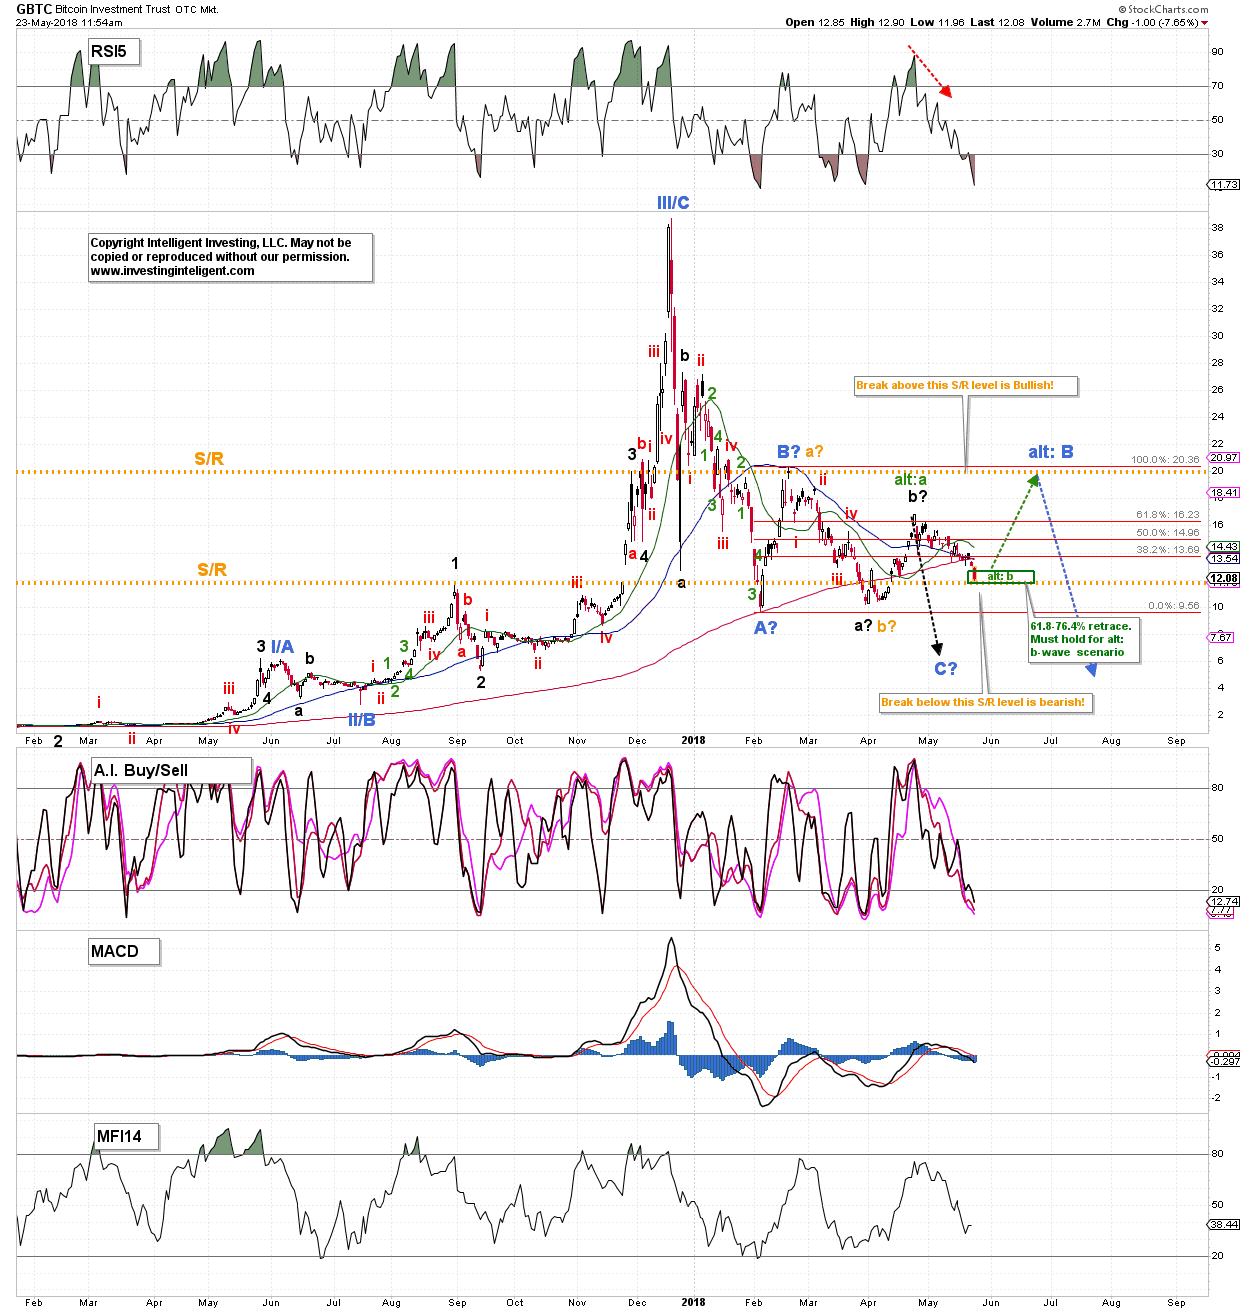
The GBTC chart has in essence the same EWT counts as the BTC chart, but what's more important here are two critical levels: the orange S/R levels at $20 and $12 with price now right at the lower level. This is strong Support -and was prior Resistance- and IF this level breaks THEN the "black" count (dotted black arrow) is operable and $6 is then the next most likely target. A break below $10 will fully confirm this EWT-count. The green box is the ideal target-zone for a smaller b-wave of a the larger (black) c-wave back up to the "alt: B" target of $20 (see item #2). But, we need to see a strong reversal out of this box, and so far that's not happening. Although the technical indicators (TIs) are oversold, they are all still pointing down and on a sell; wanting to see lower prices.

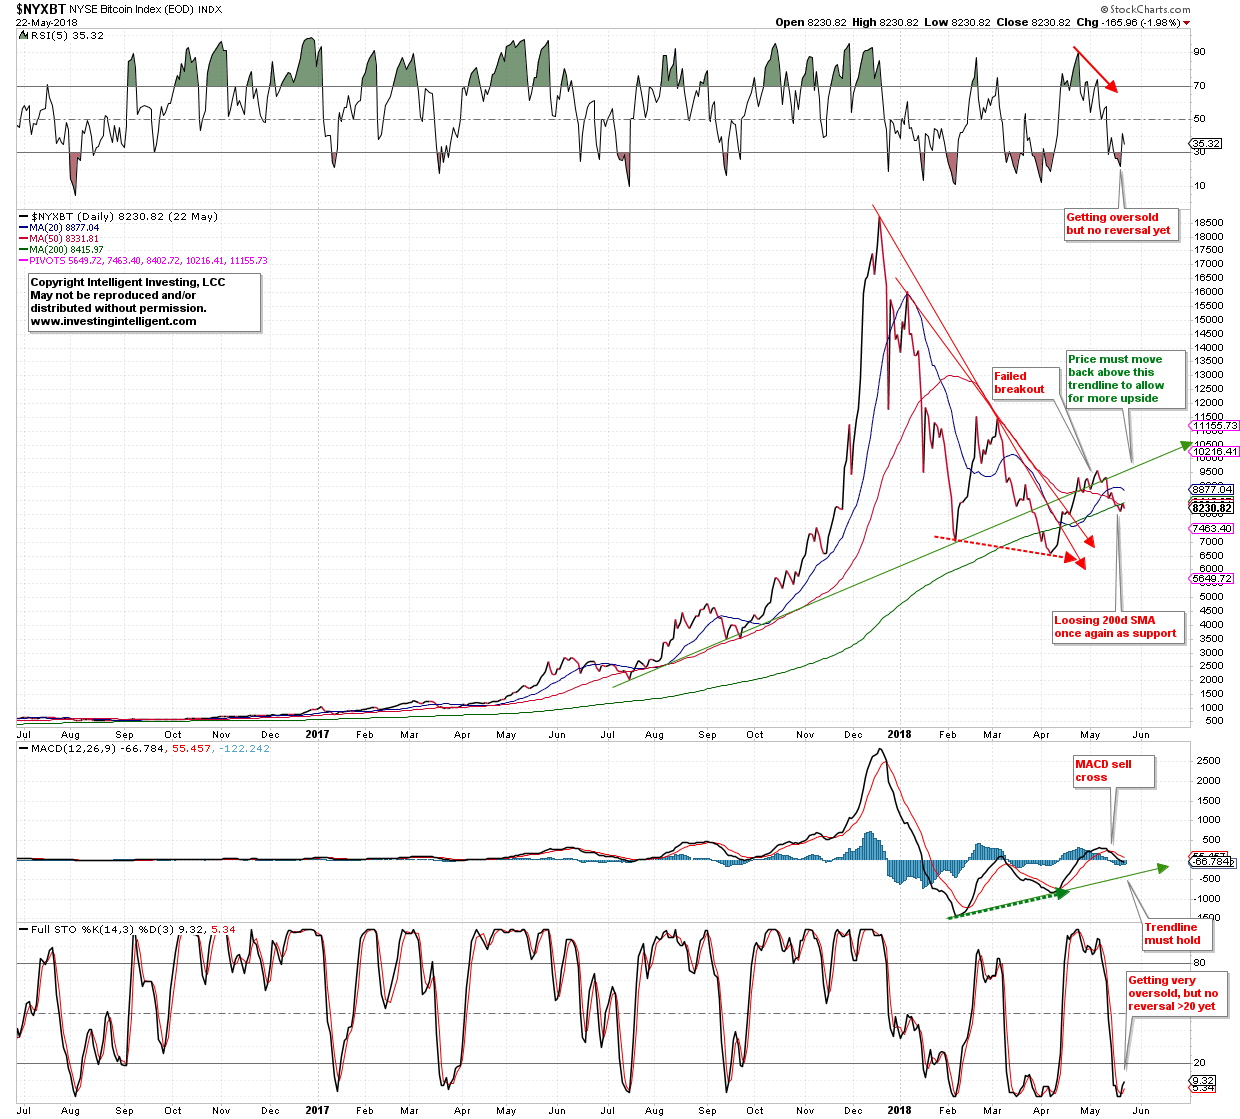
The third and final chart I'd like to share is that of the NYXBT, where there are some interesting developments going on as well. Most of these are annotated in the chart, so no need to repeat them. Bottom line is that price has so far failed to reclaim the long term uptrend, and moved back below its 200d SMA yet again. Both are for now Bearish developments until that changes. 
These bearish developments for now add weight to the evidence that BTC is moving down and not up. Only if price can move back above that green long term uptrend line -which also equates to $10,000- can we start to entertain the Bullish options as outlined above more seriously. Until then, the weight of the evidence tells us its still down-hill from here for Bitcoin.
