I haven’t discussed gold’s true fundamentals* since early December of last year, at which time I concluded:
“All things considered, for the first time in many months the true fundamentals appear to be slightly in gold’s favour. If the recent trend in the fundamental situation continues then we should see the gold price return to the $1300s early next year…”
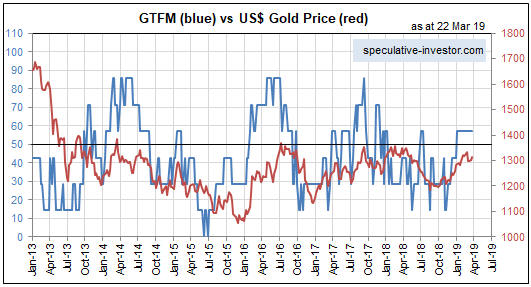
The “recent trend in the fundamental situation” did continue, enabling my Gold True Fundamentals Model (GTFM) to turn bullish at the beginning of this year (after spending almost all of 2018 in bearish territory) and paving the way for the USD gold price to move up to the $1300s.
The following weekly chart shows that after moving slightly into the bullish zone (above 50) at the beginning of January, the GTFM has flat-lined (the GTFM is the blue line on the chart, the USD gold price is the red line). Based on the current positions of the Model’s seven inputs, its next move is more likely to be further into bullish territory than a drop back into bearish territory.
As an aside, the bullish fundamental backdrop does not preclude some additional corrective activity in the near future.

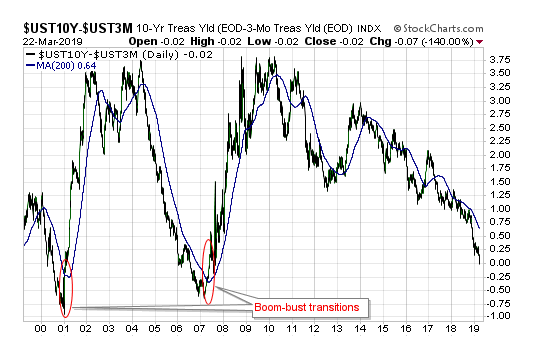
The most important GTFM input that is yet to turn bullish is the yield curve, as indicated by the 10-year:2-year yield spread or the 10-year:3-month yield spread. This input shifting from bearish to bullish requires a reversal in the yield curve from flattening (long-term rates falling relative to short-term rates) to steepening (long-term rates rising relative to short-term rates). If the reversal is driven primarily by falling short-term interest rates it indicates a boom-to-bust transition, such as occurred in 2000 and 2007, whereas if the reversal is driven primarily by rising long-term interest rates it points to increasing inflation expectations.
As illustrated below, at the end of last week there was no evidence of such a trend change in the 10-year:3-month yield spread.

The USD gold price could rise to the $1400s during the second quarter of this year as part of an intermediate-term rally, but to get a gold bull market there probably will have to be a sustained trend reversal in the yield curve.
*I use the term “true fundamentals” to distinguish the actual fundamental drivers of the gold price from the drivers that are regularly cited by gold-market analysts and commentators. According to many pontificators on the gold market, gold’s fundamentals include the volume of metal flowing into the inventories of gold ETFs, China’s gold imports, the volume of gold being transferred out of the Shanghai Futures Exchange inventory, the amount of “registered” gold at the COMEX, India’s monsoon and wedding seasons, jewellery demand, the amount of gold being bought/sold by various central banks, changes in mine production and scrap supply, and wild guesses regarding JP Morgan’s exposure to gold. These aren’t true fundamental price drivers. At best, they are distractions.
