The FTSE's rebound has lagged its European and U.S. counterparts, so with a reversal pattern forming below a resistance cluster, it could be a good contender to short if sentiment sours once again.

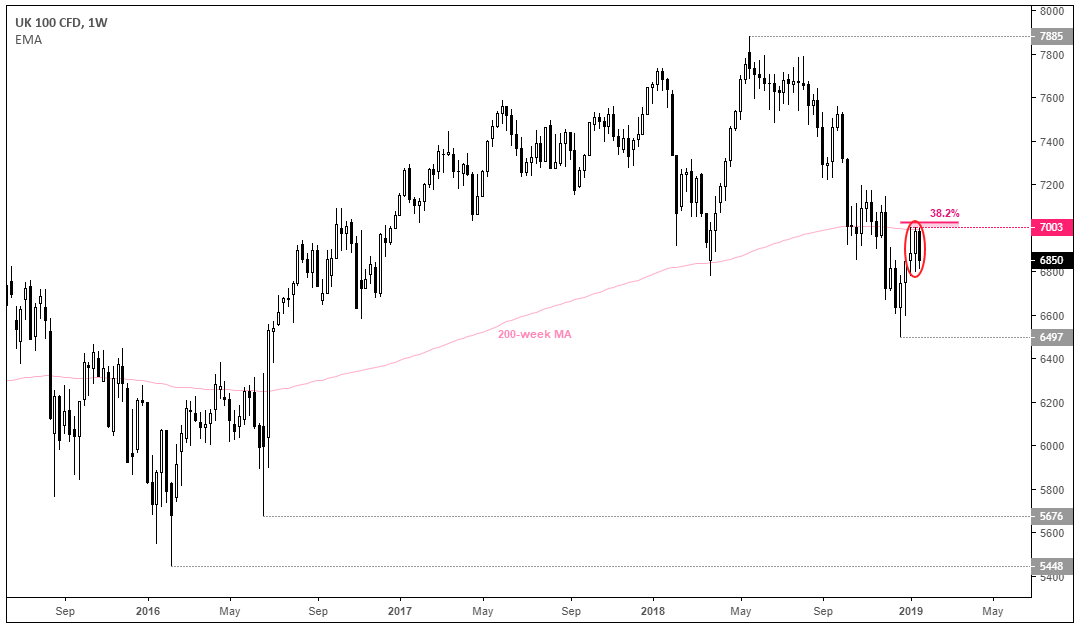
We can see on the weekly chart that the FTSE is within a strong downtrend, although it’s produced a counter-trend rally over recent weeks. Stopping just shy of a 38.2% retracement level, resistance has also been met at the 200-week average. And as these technical levels coincide with the 7k level, it places a zone of resistance between 7000-7027. Moreover, the FTSE is on track to produce a bearish reversal beneath the resistance zone (such as a dark cloud cover, bearish outside week or hanging man reversal) to complement a bearish hammer two weeks ago. And with three weekly highs in such close proximity to each other, we could be headed for a triple top pattern on the weekly chart.

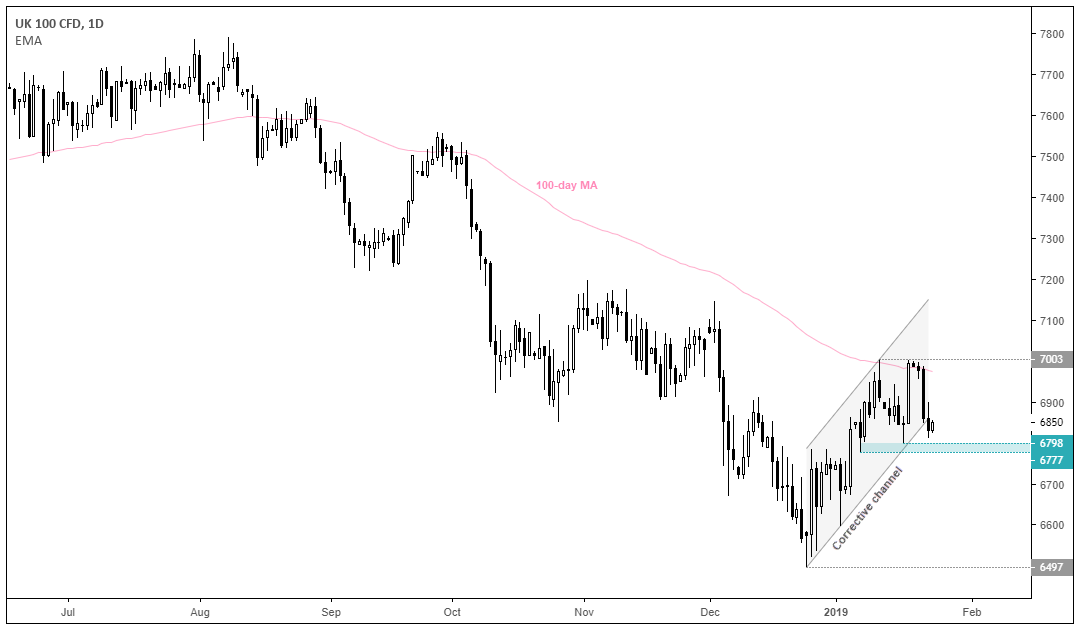
The daily chart shows the 100-day average capping as resistance and prices are attempting to break out of a corrective channel. Tuesday’s sell-off was its most bearish session in 3 months, so we’re now looking for a break beneath the 6777/98 range to signal the resumption of its bearish trend. It’s worth noting that momentum waned yesterday as prices moved towards support, but hopefully this will allow prices to compress before it breaks lower.
