“Gradual inflation has a numbing effect. It impoverishes the lower and middle class, but they don’t notice.” —Andrew Bosomworth, PIMCO Germany, as quoted in Der Spiegel
The rise of populism, evidenced by the success of Donald Trump, Bernie Sanders, and Alexandra Ocasio-Cortez, is rooted in the emergence of the greatest wealth and income inequality gap since the roaring ’20s.
According to the Economic Policy Institute, the top 1% take home 21% of all income in the United States, the largest share since 1928.
There are a variety of social, political, and economic factors driving this growing discrepancy, but one critical factor is ignored – The Federal Reserve.
The Fed has inserted itself into a key role in economic growth and along with that their contribution to the rising imbalances between economic classes.
The Wealth Gap Explodes
Over the last decade, as stock markets surged, household net worth reached historic levels. If one just looked at the data, it was clear the economy was booming.
However, for the vast majority of Americans, it really wasn’t. This was previously shown in data from the WSJ:
“The median net worth of households in the middle 20% of income rose 4% in inflation-adjusted terms to $81,900 between 1989 and 2016, the latest available data. For households in the top 20%, median net worth more than doubled to $811,860. And for the top 1%, the increase was 178% to $11,206,000.”
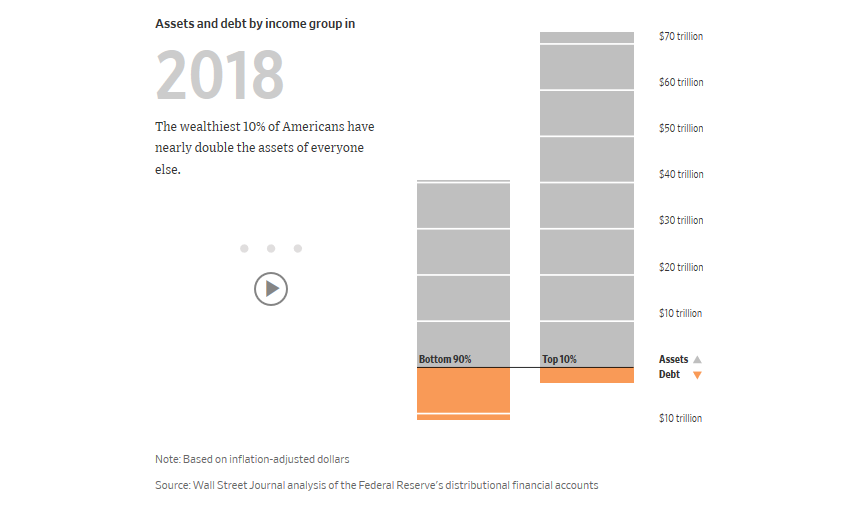
Put differently, the value of assets for all U.S. households increased from 1989 through 2016 by an inflation-adjusted $58 trillion. A full 33% of that gain—$19 trillion—went to the wealthiest 1%, according to a Journal analysis of Fed data.
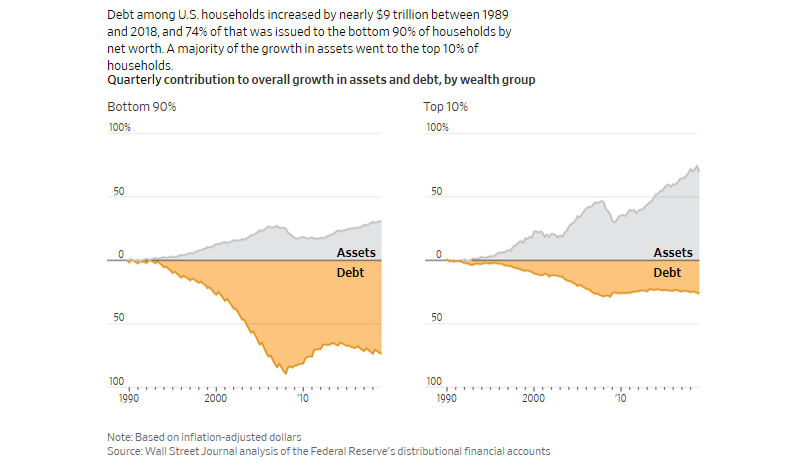
What policymakers, and the Federal Reserve missed, is the “stock market” is NOT the “economy.”
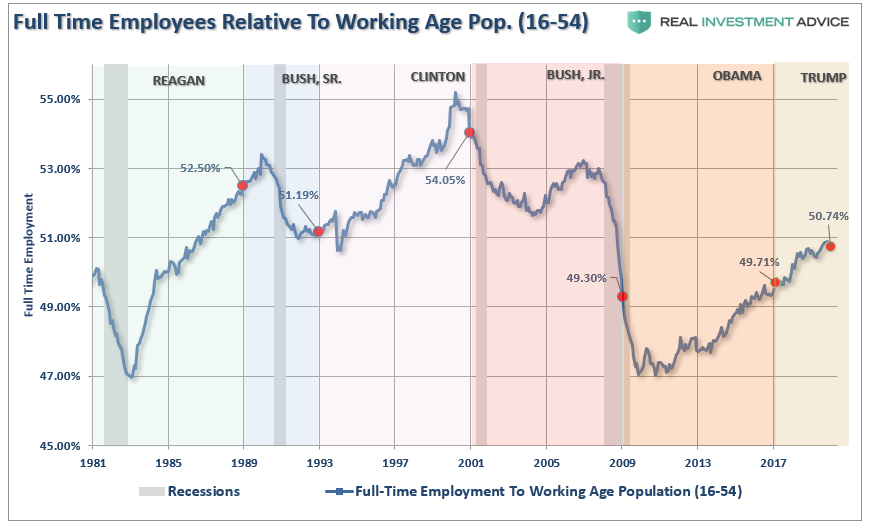
This “wealth gap,” can be directly traced back to a decade of monetary policy that almost solely benefited those who either had money to invest in the financial markets, or were directly compensated through increases in corporate asset prices. However, those policies, failed to produce substantial rates of either wage growth or full-time employment.

“But Lance, the media said that employment was at historic lows.”
True, but this was because of the large number of individuals no longer counted as part of the labor force. If we take a look at “full-time employment,” which are the jobs that support the raising of a family, and strip out those over 54-years of age to remove the “but boomers are all retiring” nonsense, we see a very different picture of employment. The weak increase in full-time employment is a key factor behind why both economic and wage growth remained weak.
The New York Times recently went further into the numbers:
“America’s economy has almost doubled in size over the last four decades, but broad measures of the nation’s economic health conceal the unequal distribution of gains. A small portion of the population has pocketed most of the new wealth, and the coronavirus pandemic is laying bare the consequences of the unequal distribution of prosperity.”
Of course, a big contributor to the “wealth gap” was the rise in the stock market fostered by trillions of liquidity injected into the markets by Federal Reserve. As NYT noted:
“The affluent, of course, do tend to own stock, and the median net worth of the richest 10 percent of households rose 13 percent from 2007 to 2016 (the last year for which the Fed has released data).
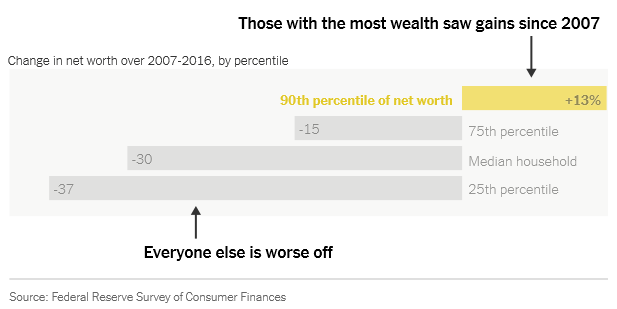
Another way to view this issue is by looking at household net worth growth between the top 10% and everyone else.
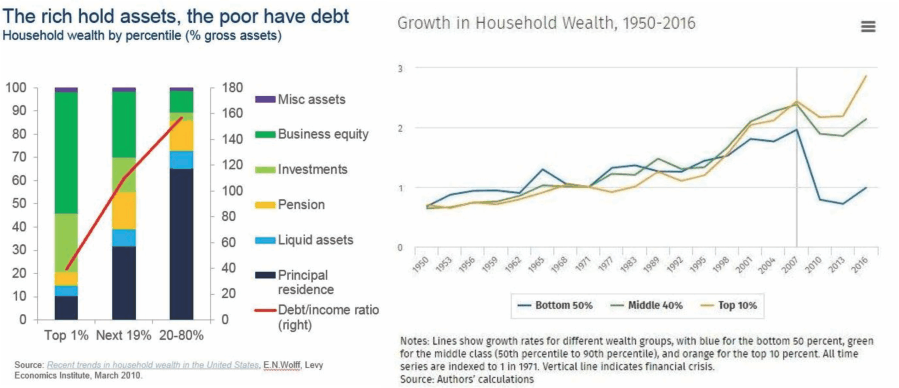
Since 2007, the ONLY group that has seen an increase in net worth is the top 10% of the population, which is also the group that owns 84% of the stock market.
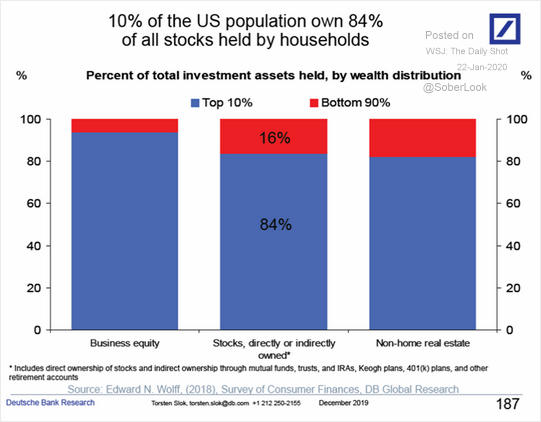
This is not economic prosperity.
This is a distortion of economics.
The Fed Did It
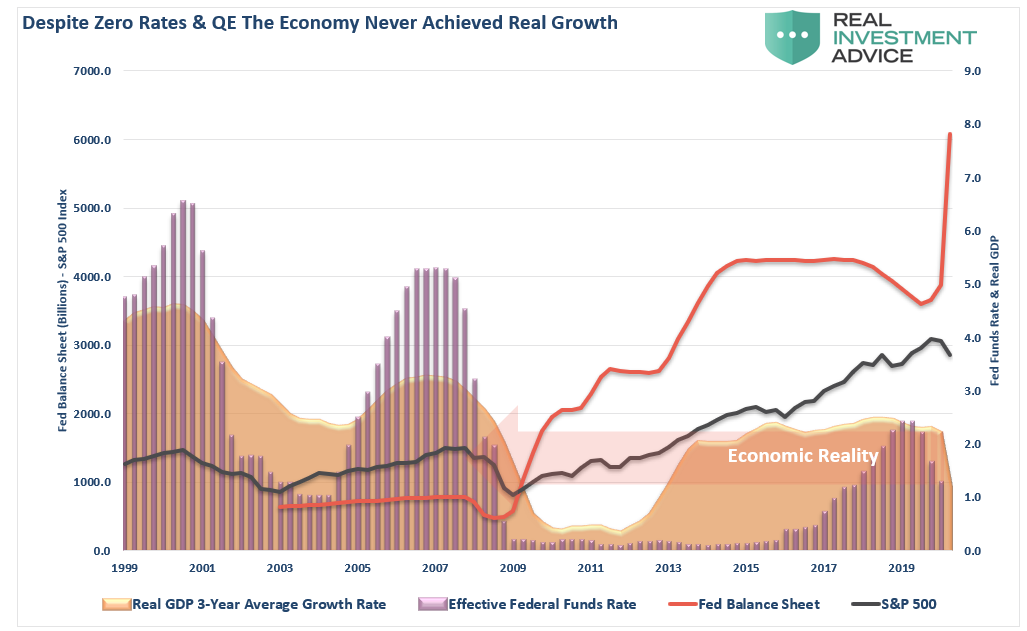
This can all be tied directly back to the Fed’s monetary interventions. From 2009-2016, the Federal Reserve held rates at 0%, and flooded the financial system with 3-consecutive rounds of “Quantitative Easing” or “Q.E,” and ensured that financial conditions remained extremely accommodative. In return, banks were supposed to use the low-rate environment to loan money to businesses, which would in turn expand capacity and hire workers, who would increase consumption boosting economic growth.
Unfortunately, it didn’t work out that way as monetary policy is a “disincentive” for banks to lend. Instead, the recycled the liquidity into the stock market, through which they have a direct and vested interest. While stock prices rose, the bottom 90% of the economy struggled to make ends meet, which capped economic growth.
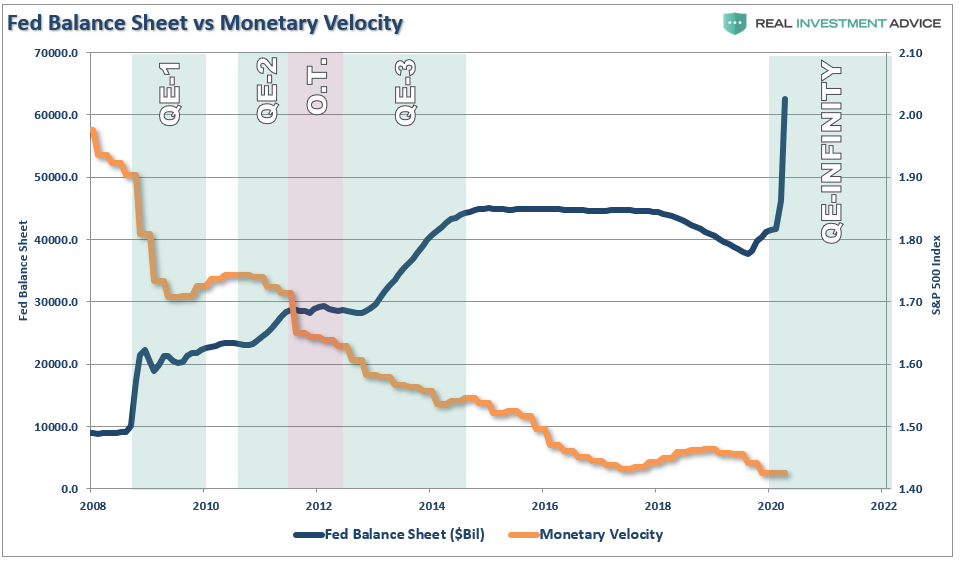
Of course, given the banks didn’t push the money into the economy, but bottled it up for their own financial interests, monetary velocity steadily declined.
If we assume just a 15% decline in GDP in the second quarter, the disparity between the Fed’s interventions, the stock market, and the real economy becomes abundantly clear. For 90% of Americans, there has not been, nor will there be, any economic recovery.
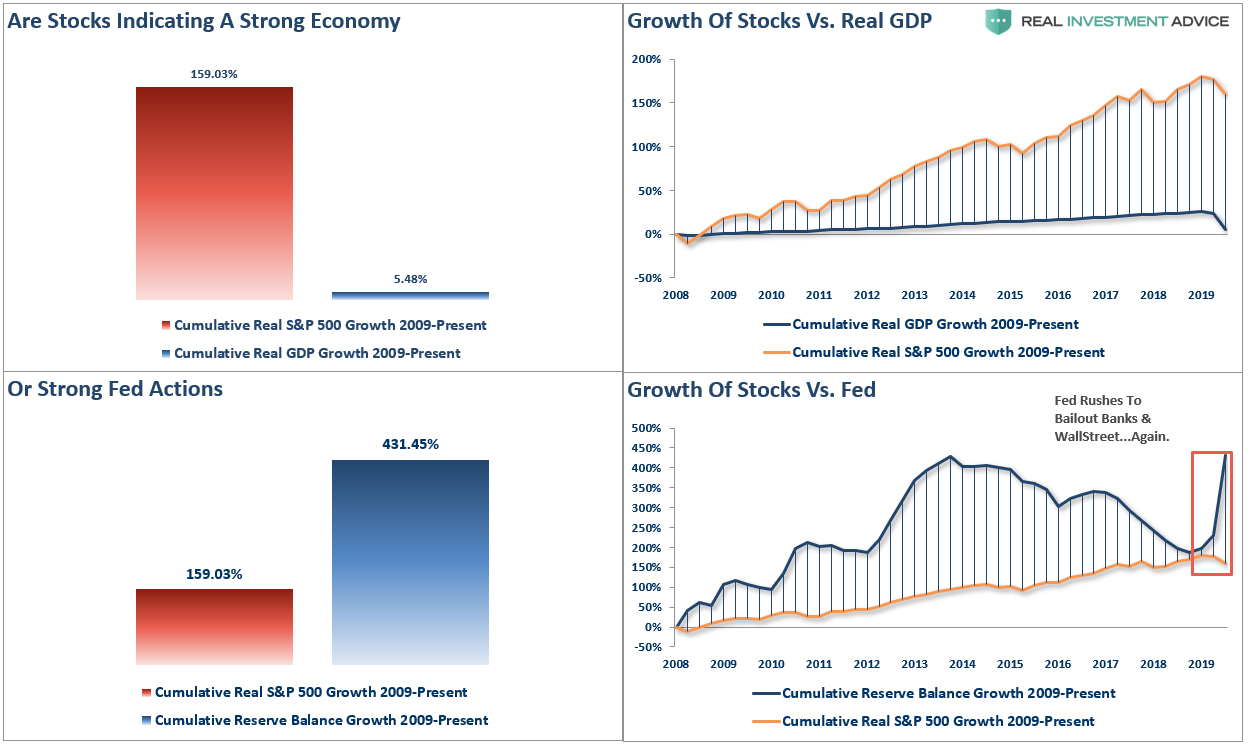
Not understood, especially by the Fed, is that the natural rate of economic growth is declining due to their very practices.
“Low, to zero, interest rates incentivize non-productive debt. The massive increases in debt, and particularly corporate leverage, actually harms future growth by diverting spending to debt service.”
The rise in corporate debt, which in the last decade was used primarily for non-productive purposes such as stock buybacks and issuing dividends, has contributed to the retardation of economic growth.
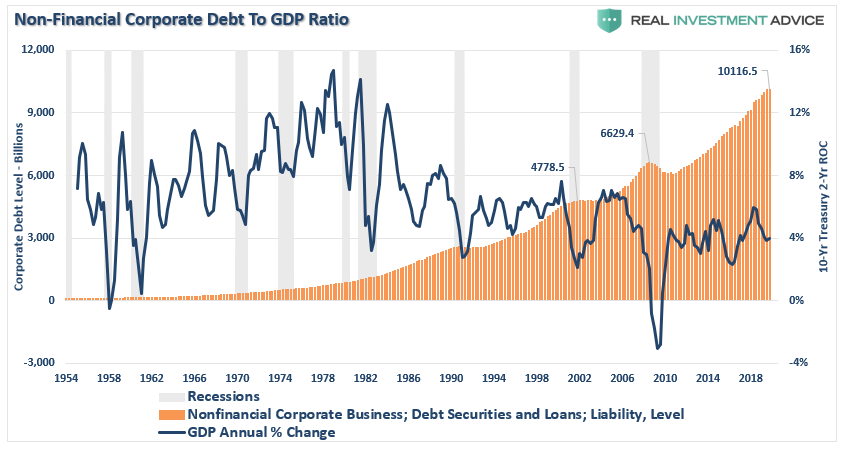
The Federal Reserve Act requires that monetary policy achieve maximum employment, stable prices, and moderate long-term interest rates. The problem is the Fed targeted a small, but consistent 2% rate of inflation. What they didn’t realize was their very policies were retarding inflation but creating a debt bubble which was slowing economic growth and creating deflationary pressures. The result was an increasing set of dynamics which harmed the poor and middle class while, enriching the wealthy, and widening the wealth inequality gap over time.
The Fed Has No Choice But To Make It Worse
With the economy now on the brink of an “economic depression,” and in the middle of an election year, the Federal Reserve had a choice to make.
- Allow capitalism to take root by allowing corporations to fail, and restructure, after spending a decade leveraging themselves to hilt, buying back shares, and massively increasing the wealth of their executives while compressing the wages of workers. Or,
- Bail out the “bad actors” once again to forestall the “clearing process” that would rebalance the economy, and allow for higher levels of future organic economic growth.
Obviously, as the Fed’s balance sheet heads toward $10 Trillion, the Fed opted to impede the “clearing process.” By not allowing for debt to fail, corporations to be restructured, and “socializing the losses,” they have removed the risk of speculative practices and have ensured a continuation of “bad behaviors.”
Unfortunately, given we now have a decade of experience of watching the “wealth gap” grow under the Federal Reserve’s policies, the next decade will only see the “gap” worsen.
While there are many hoping for a “V-shaped” recovery in the economy following the “restart” of the economy, the reality is that recovery may take much longer than expected.
Furthermore, given that we now know that surging debt and deficits inhibit organic growth, the massive debt levels being added to the backs of taxpayers will only ensure lower long-term rates of economic growth. The chart below shows the 10-year annualized run rates of economic throughout history with projecting debt and growth levels over the next decade.
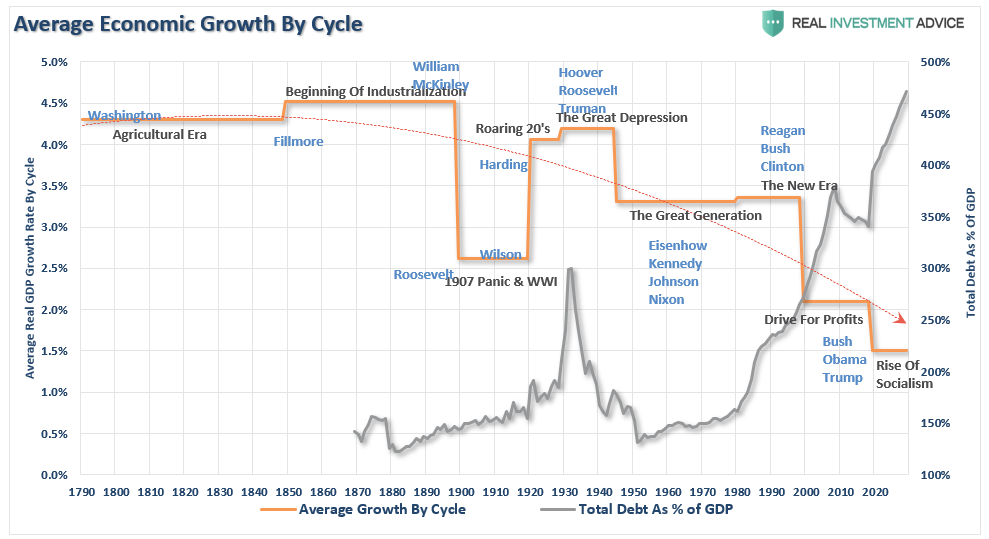
History is pretty clear about future outcomes from the Fed’s current actions. More importantly, these actions are coming at a time where there were already tremendous headwinds plaguing future economic growth.
- A decline in savings rates
- An aging demographic
- A heavily indebted economy
- A decline in exports
- Slowing domestic economic growth rates.
- An underemployed younger demographic.
- An inelastic supply-demand curve
- Weak industrial production
- Dependence on productivity increases
The lynchpin, like Japan, remains demographics and interest rates. As the aging population grows becoming a net drag on “savings,” the dependency on the “social welfare net” will continue to expand. The “pension problem” is also going to require further bailouts and more government debt.
Yes, another $4-6 Trillion in QE will likely be successful in inflating a third “bubble” to counteract the deflation of the last.
The problem is that after a decade of pulling forward future consumption to stimulate economic activity, a further expansion of the wealth gap, increased indebtedness, and low rates of economic growth, will weigh on future economic opportunity for the masses.
Supporting economic growth through increasing levels of debt only makes sense if “growth at all cost” uniformly benefits all citizens. Unfortunately, we are finding out there is a big difference between growth and prosperity.
An inflationary policy that minimizes concern for debt burdens, while accelerating the growth of those burdens, is taking a serious toll on economic and social stability.
The United States is not immune to social disruptions. The source of these problems is compounding due to the public’s failure to appreciate why it is happening. Until the Fed’s policies are publicly discussed and reconsidered, the policies will remain, and the problems will grow.
But for now, it seems the Fed simply has no other choice.
