Technically Speaking June 17- 21Summary
- Banks are growing more concerned about downside risk.
- The Fed is much more worried about the US economy than we thought.
- The moving average picture in the market is weaker than the daily noise lets on.
International Economic Releases of Note
EU/UK/Canada
EU
- Labor costs up 2.4% Y/Y
- Exports up 5.2% y/y
- Inflation down to 1.2%
- Construction up 3.9% Y/Y
- Consumer confidence at 7.2%
- Flash PMI: Manufacturing 47.8; Service 53; Composite 52.1
UK
- Inflation at 1.9%
- Retail sales down .5% M/M up 2.3% Y/Y
Canada
- Inflation up 2.5% Y/Y
- Retail sales increased by 1% M/M
- China/Japan/Australia/Asia
Japan
- Exports down 7.8% Y/Y
- Flash PMI at 49.5
Australia
- Westpac leading index -.45%
Asia
- South Korean PPI .4% Y/Y
- Central Bank Actions of Note
The Bank of England maintained interest rates at 0.75%. Here is how they characterized the risk environment (emphasis added):
Since the Committee’s previous meeting, the near-term data have been broadly in line with the May Report, but downside risks to growth have increased. Globally, trade tensions have intensified. Domestically, the perceived likelihood of a no-deal Brexit has risen. Trade concerns have contributed to volatility in global equity prices and corporate bond spreads, as well as falls in industrial metals prices. Forward interest rates in major economies have fallen materially further. Increased Brexit uncertainties have put additional downward pressure on UK forward interest rates and led to a decline in the sterling exchange rate.
The UK economy has been surprisingly resilient in the face of Brexit. Inflation has come down to 2%; unemployment is 3.8%. GDP grew at a 1.8% annual rate in the latest report. There are a few signs of weakness in the coincidental indicators, however. Although still positive, retail sales dropped to a 2.3% Y/Y growth rate in the latest report while industrial production was 1% (Y/Y) lower.
The Central Bank of Brazil maintained rates at 6.5%. Here is how they described the current economy:
Recent data on economic activity indicate a halt in the process of economic recovery in the past quarters. Copom's baseline scenario assumes resumption of this process ahead, in a gradual fashion;
The global outlook has become less challenging, owing to changes in the prospects for monetary policy in major economies. Nevertheless, the risks associated with a slowdown in global growth remain;
The Committee judges that various measures of underlying inflation are running at appropriate levels. This includes the components that are most sensitive to the business cycle and monetary policy
Brazil is facing challenging economic times. The annual GDP growth rate was 0.5% in the latest reading and has been weak for a number of quarters. Unemployment has increased to 12.5% (although it's been pretty high for the last 12 months); industrial production was down 3.9% and has declined in 7 of the last 12 months; retail sales were up 1.7% Y/Y. Inflation is running at 4.6%.
The Bank of Japan maintained its current negative interest rate policy in addition to the "yield curve control" and ETF purchases intervention. Here is how they characterized the current state of the Japanese economy:
Japan's economy has been on a moderate expanding trend, with a virtuous cycle from income to spending operating, although exports and production have been affected by the slowdown in overseas economies. Overseas economies have been growing moderately on the whole, although slowdowns have been observed. In this situation, exports and industrial production have shown some weakness. On the other hand, corporate profits and business sentiment have stayed at favorable levels on the whole, albeit with some weakness observed in part, and business fixed investment has continued on an increasing trend. Private consumption has been increasing moderately, albeit with fluctuations, against the background of steady improvement in the employment and income situation. Housing investment has been more or less flat. Public investment also has been more or less flat, remaining at a relatively high level. Meanwhile, labor market conditions have continued to tighten steadily. Financial conditions are highly accommodative. On the price front, the year-on-year rate of change in the consumer price index (CPI, all items less fresh food) is in the range of 0.5-1.0 percent. Inflation expectations have been more or less unchanged.
GDP growth was decelerated during the last three quarters; the latest annual growth rate was 0.9%. Retail sales were recently reported at a 0.5% Y/Y rate while industrial production decreased 1.1%. The former has been modestly weaker since February while the latter has declined in 6 of the last 12 months. Unemployment is 2.4%. Deflation remains Japan's biggest problem; it has been below 1% since November 18.
US Economic Data of Note
This week the Census released the latest building permits data (which increased 0.3%) and the National Association of Realtors reported that existing home sales advanced 2.5%. However, the most important economic activity came from the Federal Reserve. Let's begin with the latest Beige Book, which contained the following assessment of the U.S. economy:
Economic activity expanded at a modest pace overall from April through mid-May, a slight improvement over the previous period. Almost all Districts reported some growth, and a few saw moderate gains in activity. Manufacturing reports were generally positive, but some Districts noted signs of slowing activity and a more uncertain outlook among contacts. Residential construction and real estate both showed overall growth, but both sectors saw wide variation in sentiment across Districts. Reports on consumer spending were generally positive but tempered. Tourism activity was stronger, especially in the Southeast, but vehicle sales were lower, according to reporting Districts. Loan demand was mixed but indicated growth. Agricultural conditions remained weak overall, but a few Districts reported some improvements. The outlook for the coming months was solidly positive but modest, with little variation among reporting Districts.
The emboldened comments are positive but the emboldened and italicized comments hedge the good points. There is actually a large amount of weakness above - all the positive points are followed by a "but" commentary. That led to the Fed removing its use of the word "patience" in its previous statement and replacing it with this on Wednesday:
The Committee continues to view sustained expansion of economic activity, strong labor market conditions, and inflation near the Committee's symmetric 2 percent objective as the most likely outcomes, but uncertainties about this outlook have increased. In light of these uncertainties and muted inflation pressures, the Committee will closely monitor the implications of incoming information for the economic outlook and will act as appropriate to sustain the expansion, with a strong labor market and inflation near its symmetric 2 percent objective.
Translation: we're now taking a dovish stance. If there was any doubt about the Fed's policy position, the announcement that two Fed governors are worried about low inflation removed it:
Two U.S. central bankers on Friday sounded the alarm on sluggish U.S. inflation and called for immediate action in response, in what amounted to a broadside against the slim majority of Federal Reserve policymakers who are disinclined to support interest rate cuts this year.
Minneapolis Fed President Neel Kashkari said in an essay he had argued for a 50 basis point interest-rate cut at this week’s policy-setting meeting. Such aggressive action is needed to re-anchor inflation expectations that have dropped below the Fed’s 2% target, he said.
.....
In a separate statement released earlier in the day, St. Louis Federal Reserve President James Bullard said he dissented at this week’s meeting because he felt weak inflation and uncertainties about the outlook for economic growth warranted an interest rate cut.
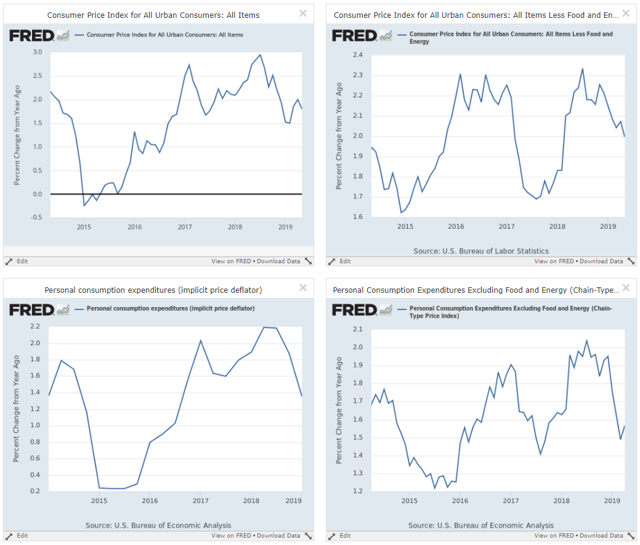
Here's a chart of the relevant data:
The top two panels show CPI while the bottom panels show the PCE price deflator. The left charts show the overall data for each statistic while the right chart shows the core. All are declining; the PCE core index was recently as low as 1.5% - a remarkably low rate for an economy in its 8th year of expansion with an unemployment rate below the full employment level.
The Federal Reserve is now more concerned about the economy than previously thought.
The US Markets Aren't As Strong As You'd Think
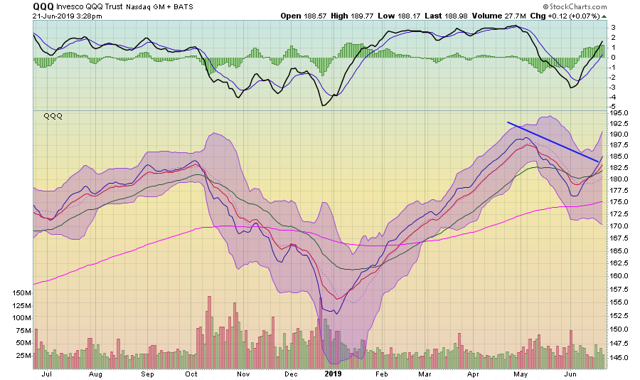
Today, I want to strip out the daily noise of the markets and focus on the longer-term trends in the averages. To do that, I'm going to strip the price bars out of the charts and look exclusively at the 10, 20, 50, and 200-day EMAs. Let's start with the QQQ:
This is a good chart. The 200-day EMA (in pink) is moving modestly higher. The shorter EMAs are above the 200-day EMA, and the shorter EMAs are above the longer EMAs.
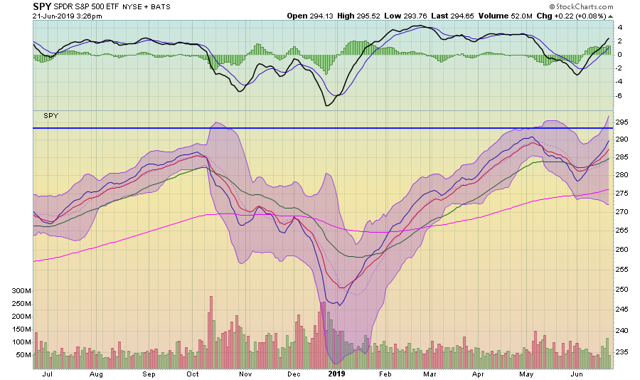
The SPY has the exact same trend.
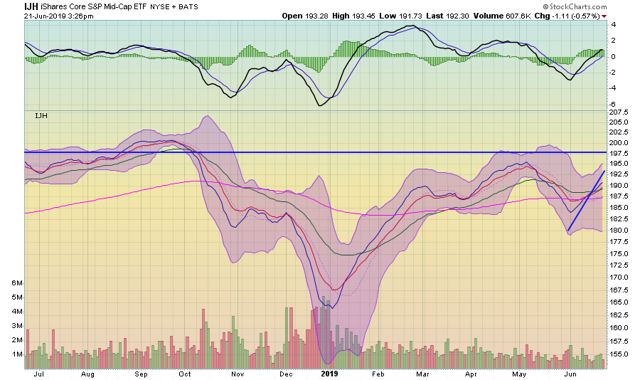
The trend begins to deteriorate a bit with the mid-caps. The 200-day EMA is moving more sideways, meaning the longer-term trend is less bullish. The shorter EMAs are still above the longer EMAs, but to a smaller degree. And, the 10 and 20-day EMA briefly dipped below the 200-day EMA.
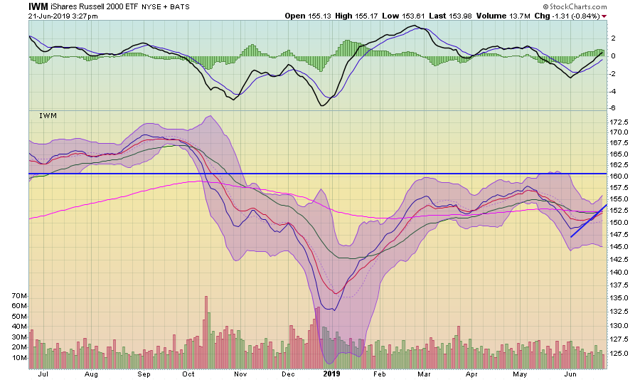
The small-caps EMA picture is weaker. The 200-day EMA is moving modestly lower and all of the EMAs are below the 200-day EMA.
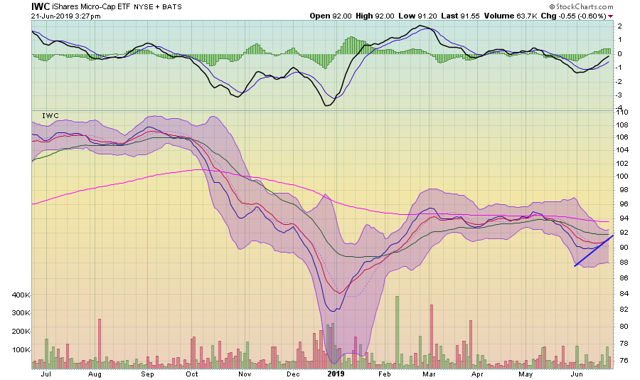
The trend of weaker underlying technicals continues with the micro-caps. The 200-day EMA is moving lower; the shorter EMAs are below the longer; the 20 and 50-day EMA are still moving lower.
Next, we have the Treasury market:
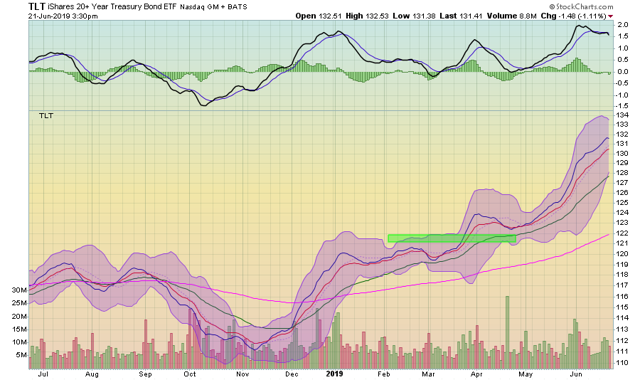
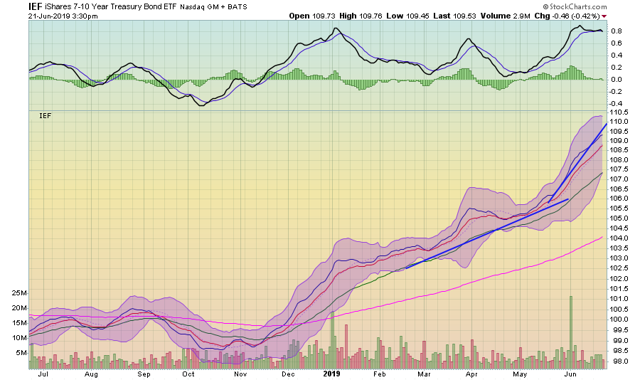
Both the IEF (7-10 year Treasury market, top chart) and TLT (20+ Treasury, lower chart) have very bullish charts. All the EMAs are moving higher and the shorter EMAs are above the longer. These are the charts you'd expect to see in a bullish equity chart.
We remain in a standard, end-of-the-cycle pattern: large-caps are rallying, small-caps are underperforming, and the Treasury market has the strongest chart of them all. Adding to the concern is the central bank, which is more concerned about the economy than they're letting on.

