The Fed Has Bankrupted The U.S. In Order To Create Another Bubble

Published 04/28/2017, 01:12 AM
Updated 07/09/2023, 06:31 AM
US10YT=X
-

Yesterday’s article caused quite a stir.

The basic premise is that when you value the stock market based on objective metrics that cannot be fudged, it’s more overpriced than it was at the 2007 peak and is rapidly approaching the 1999 peak.

However, the underlying reason that stocks are so ridiculously overpriced has to do with another asset class: bonds.

The fact is that by keeping interest rates at zero for seven years, the Fed has created a bubble in bonds. Back in 2008, the US’s Debt to GDP was just 65%.

Thanks to seven years of ZIRP, the US Government was able to go on a massive spending spree, ballooning the Debt to GDP to above 105% where it sits today.
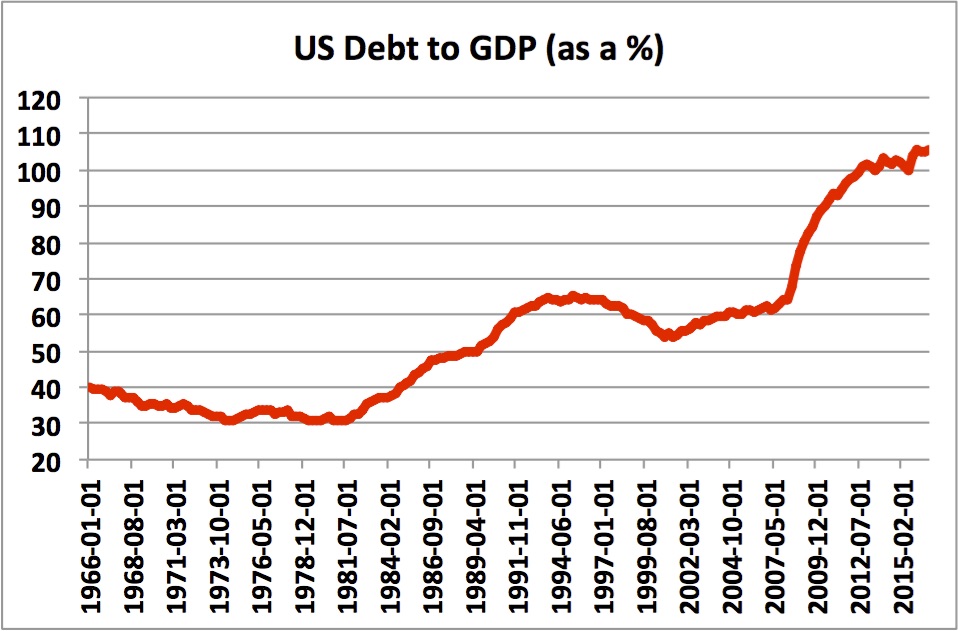
US Debt To GDP

How does this impact stocks?

According to the Fed Model for valuing assets, stock prices trade based on interest rates (bond yields).

The equation is the following:

(Stock Earnings/ Stock Prices)= 10 Year Treasury Yields.

So… if yields are pushed to record lows courtesy of Fed policy… and earnings are not growing rapidly to make up the difference, stock prices must soar.

If this sounds like a load of nonsense to you, it is in fact the primary argument the financial elites are making for why stocks are such a bargain even today.

Measured against interest rates, stocks actually are on the cheap side compared to historic valuations. ~Warren Buffett in an interview with CNBC February 2017.

Buffett is indirectly revealing the Fed’s whole game here: drive yields down so that stocks will rally. Indeed, this was the entire point of Fed activity post-2008: to reflate another bubble (this time in bonds) forcing capital into the financial markets.

So in this sense, stocks are in fact in a derivative bubble… a bubble that is derived from another bubble (this one in bonds). And it will end as all bubbles do: in disaster.

The below chart isn’t a pretty one, but it’s worth keeping in mind as stocks move ever higher into nosebleed territory.
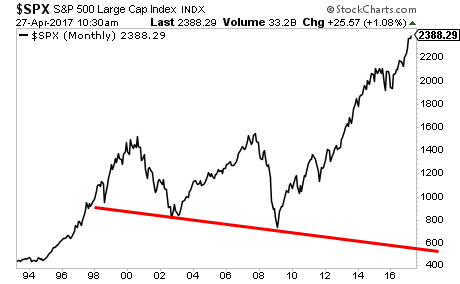
SPX Monthly Chart

Latest comments

Loading next article…
Risk Disclosure: Trading in financial instruments and/or cryptocurrencies involves high risks including the risk of losing some, or all, of your investment amount, and may not be suitable for all investors. Prices of cryptocurrencies are extremely volatile and may be affected by external factors such as financial, regulatory or political events. Trading on margin increases the financial risks.
Before deciding to trade in financial instrument or cryptocurrencies you should be fully informed of the risks and costs associated with trading the financial markets, carefully consider your investment objectives, level of experience, and risk appetite, and seek professional advice where needed.
Fusion Media would like to remind you that the data contained in this website is not necessarily real-time nor accurate. The data and prices on the website are not necessarily provided by any market or exchange, but may be provided by market makers, and so prices may not be accurate and may differ from the actual price at any given market, meaning prices are indicative and not appropriate for trading purposes. Fusion Media and any provider of the data contained in this website will not accept liability for any loss or damage as a result of your trading, or your reliance on the information contained within this website.
It is prohibited to use, store, reproduce, display, modify, transmit or distribute the data contained in this website without the explicit prior written permission of Fusion Media and/or the data provider. All intellectual property rights are reserved by the providers and/or the exchange providing the data contained in this website.
Fusion Media may be compensated by the advertisers that appear on the website, based on your interaction with the advertisements or advertisers.
© 2007-2025 - Fusion Media Limited. All Rights Reserved.