This article was written exclusively for Investing.com
- US dollar falls through critical technical support
- Metals are watching the greenback
- Energy and agricultural prices are also sensitive
- 2008-2011 could be a sign that a weaker dollar will turbocharge commodity prices
The US dollar is the global reserve currency. That status is allocated to the foreign exchange instrument that the world perceives as the most stable from an economic and political perspective. Central banks hold reserve currencies for international commerce and balance of trade reasons.
As the leading reserve foreign exchange instrument, the dollar is also the international pricing benchmark for commodities. A rising dollar tends to weigh on raw material prices, while a falling dollar often causes commodity prices to move higher.
The Dollar Index measures the value of the USD against other leading reserve foreign exchange instruments. Since the euro is also a reserve currency, the index has an over 57% exposure to the European single currency.
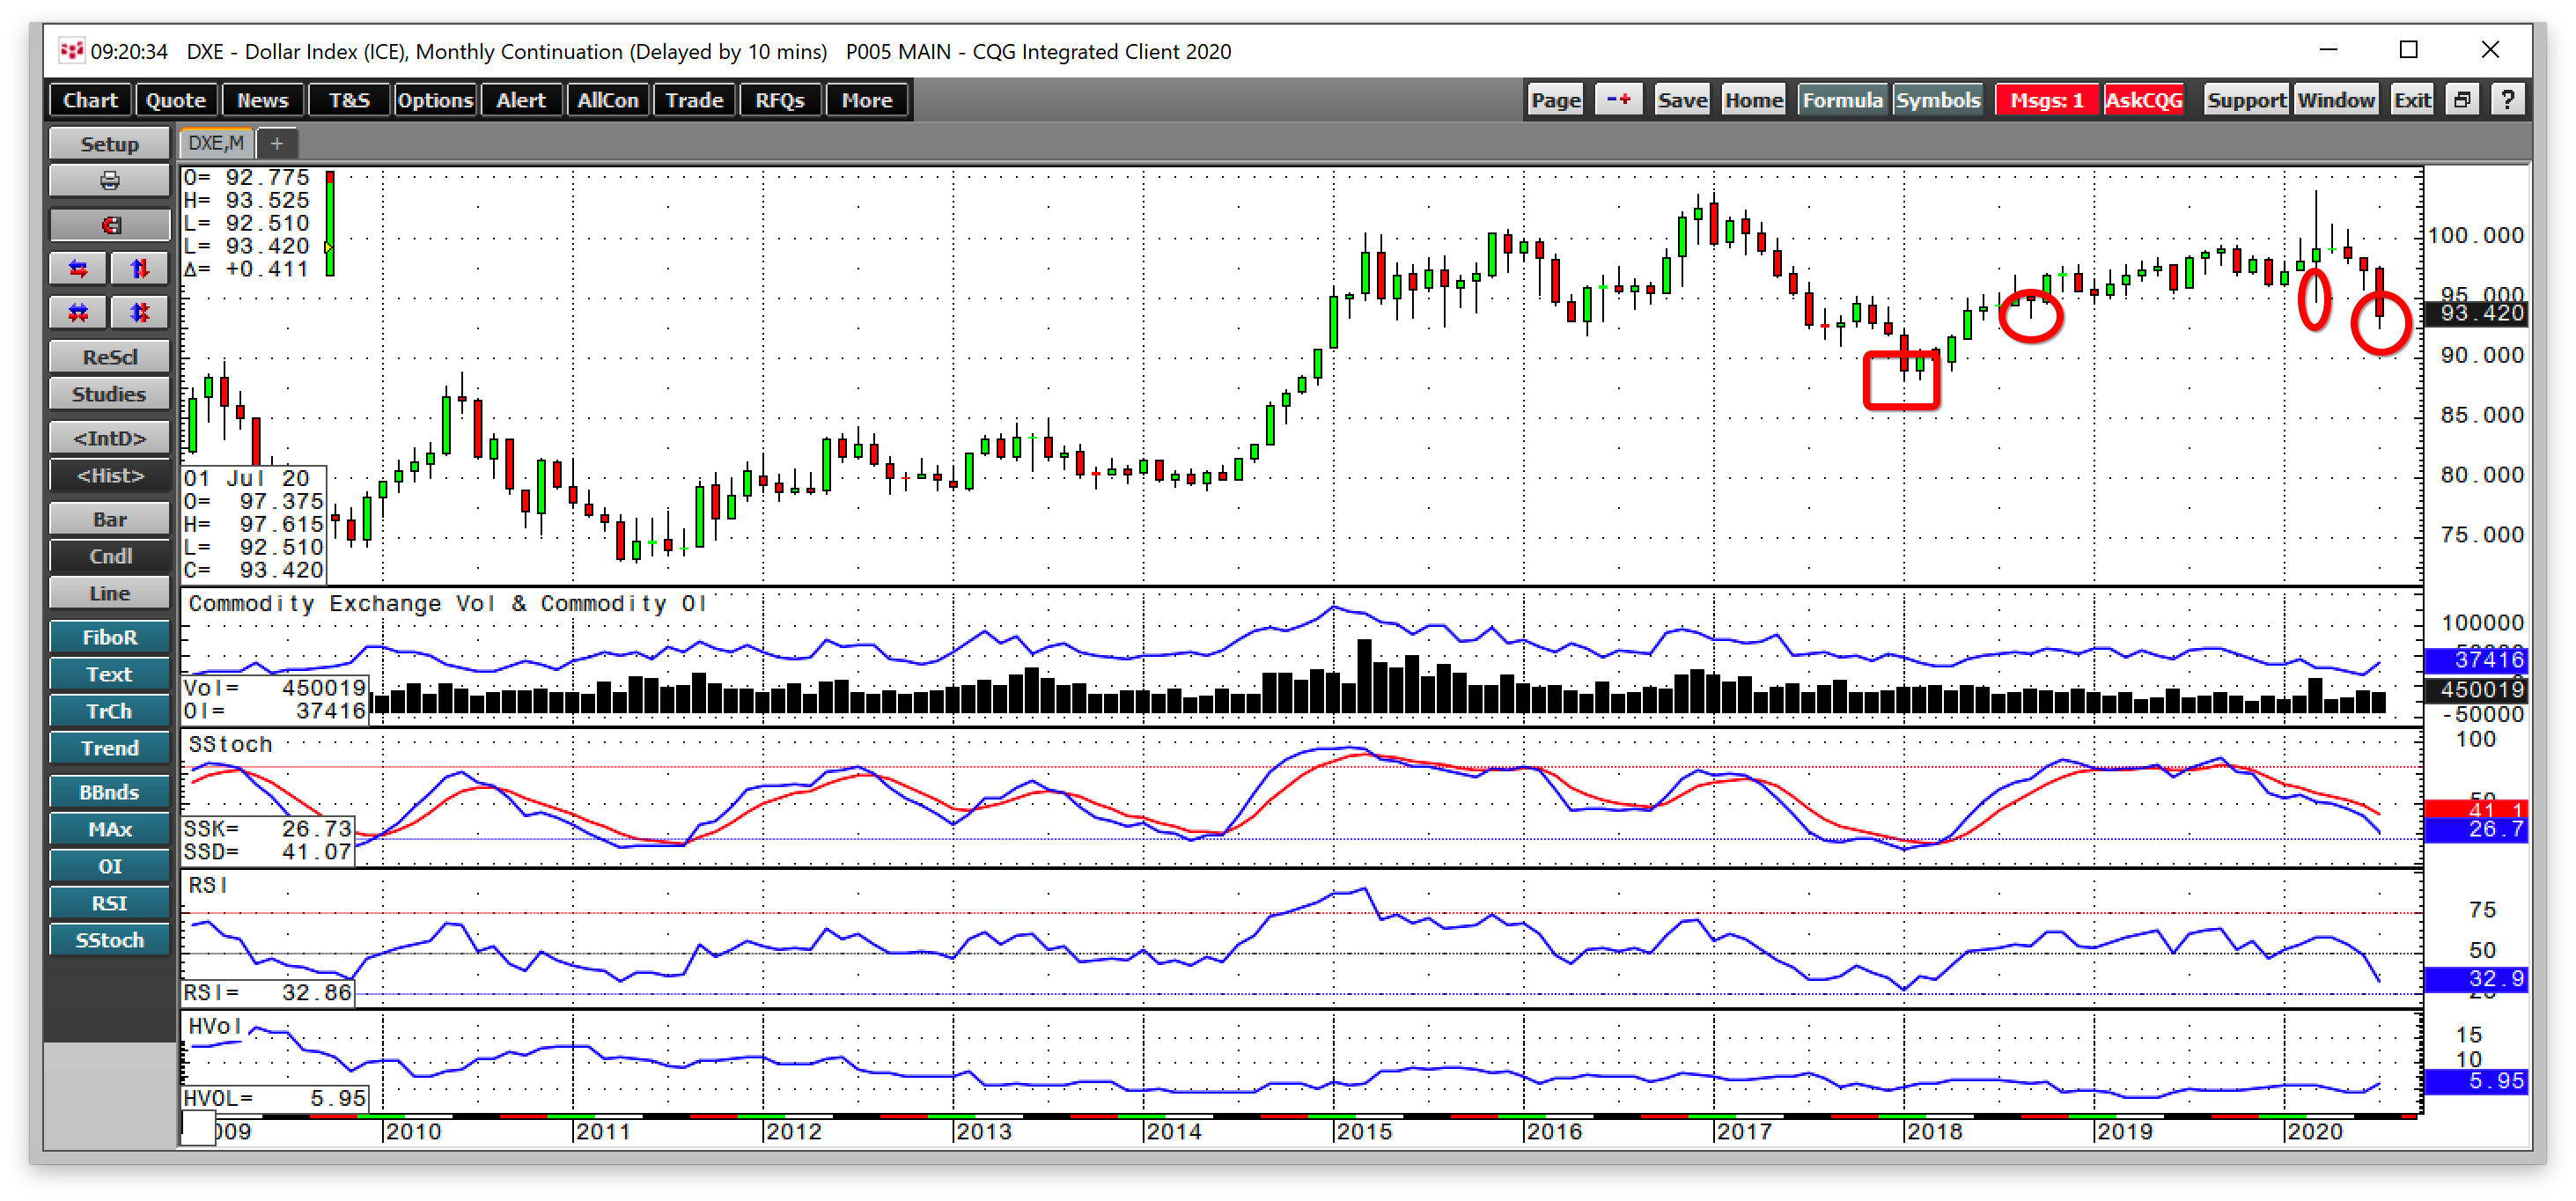
The Dollar Index reached a low of 88.15 in February 2018. It rose to a high of 103.96 in late March during the risk-off conditions caused by the global COVID-19 pandemic.
Since then, the index has turned lower and broke through critical technical support levels. The decline of the US dollar has been one factor driving many commodity prices higher.
US dollar falls through critical technical support
Last week, the Dollar Index fell below a level that could be a gateway for a test of the February 2018 low.
Source, all charts: CQG
The chart above highlights that the September, Dollar Index futures contract fell to a low of 93.33 on July 29, below the September 2018 low of 93.395. With the break below technical support, the downside target is now at the critical resistance level at 88.15.
Price momentum and relative strength indicators on the monthly chart are falling, and historical volatility is rising as monthly trading ranges have expanded. Open interest, the total number of open long and short positions in the Dollar Index futures contract, has been rising since June as the index declined.
Increasing open interest along with falling price is typically a technical validation of a bearish trend in a futures market. The technical signs in the Dollar Index are pointing lower.
Since the dollar is the benchmark pricing mechanism for many commodities, the dollar’s decline is pushing commodity prices higher.
Metals are watching the greenback
Gold is both a currency and a commodity. Central banks worldwide hold the yellow metal as an integral part of their foreign currency reserves.
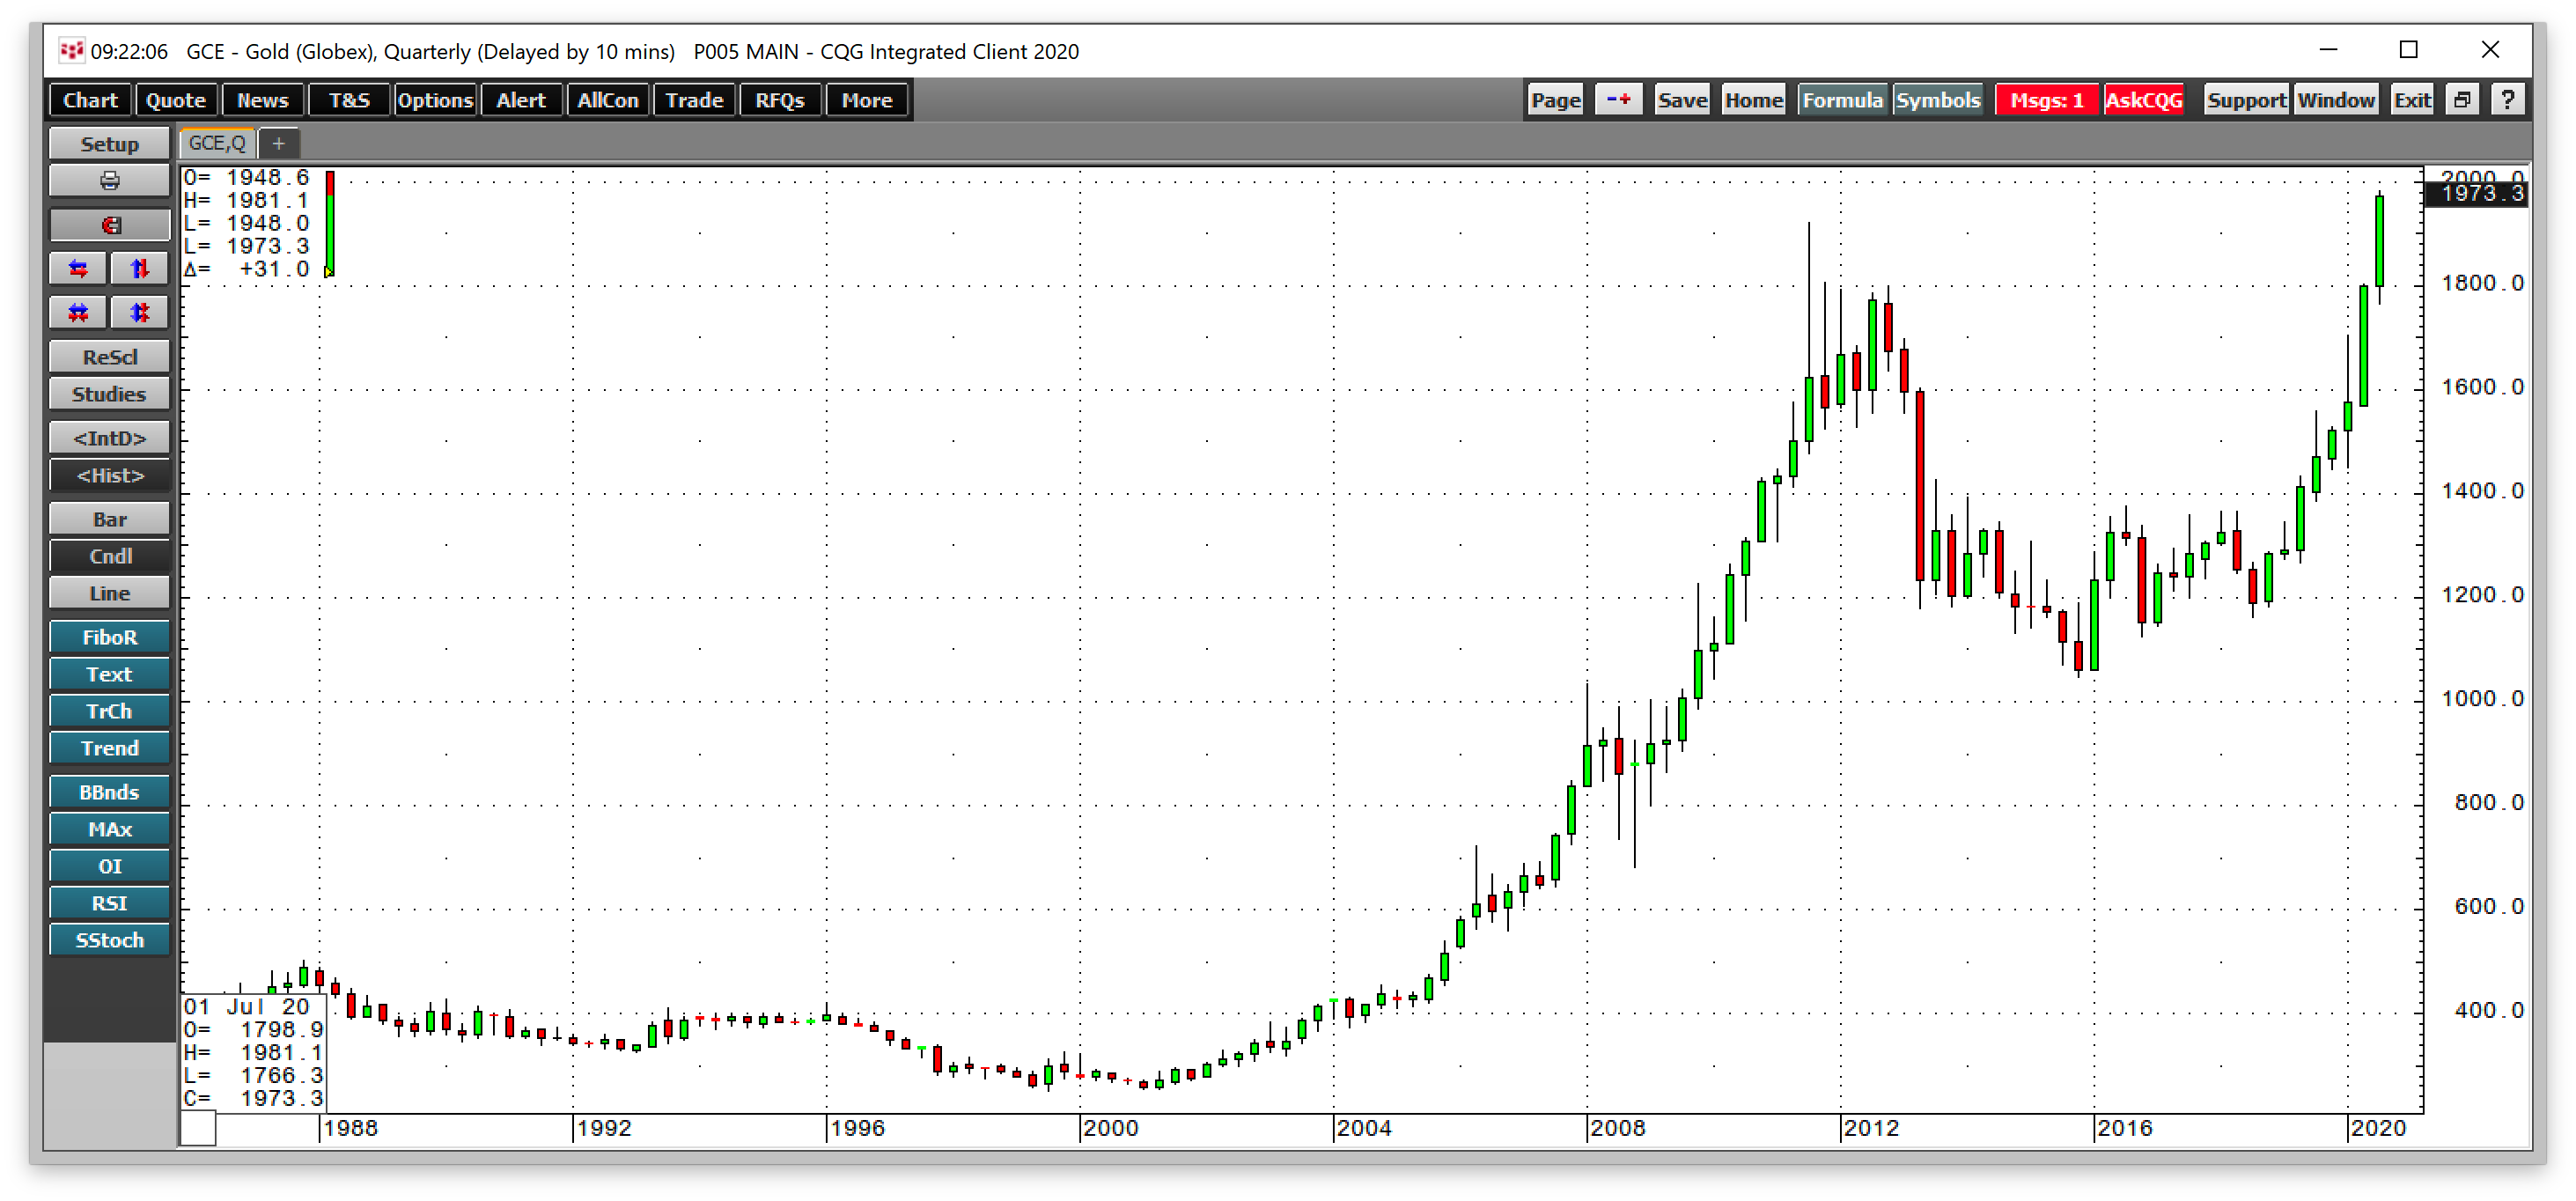
The quarterly chart of COMEX gold futures illustrates that the yellow metal rose to a new high last week. The price surpassed the 2011 peak at $1920.70 and was at over the $1970 level last Friday.
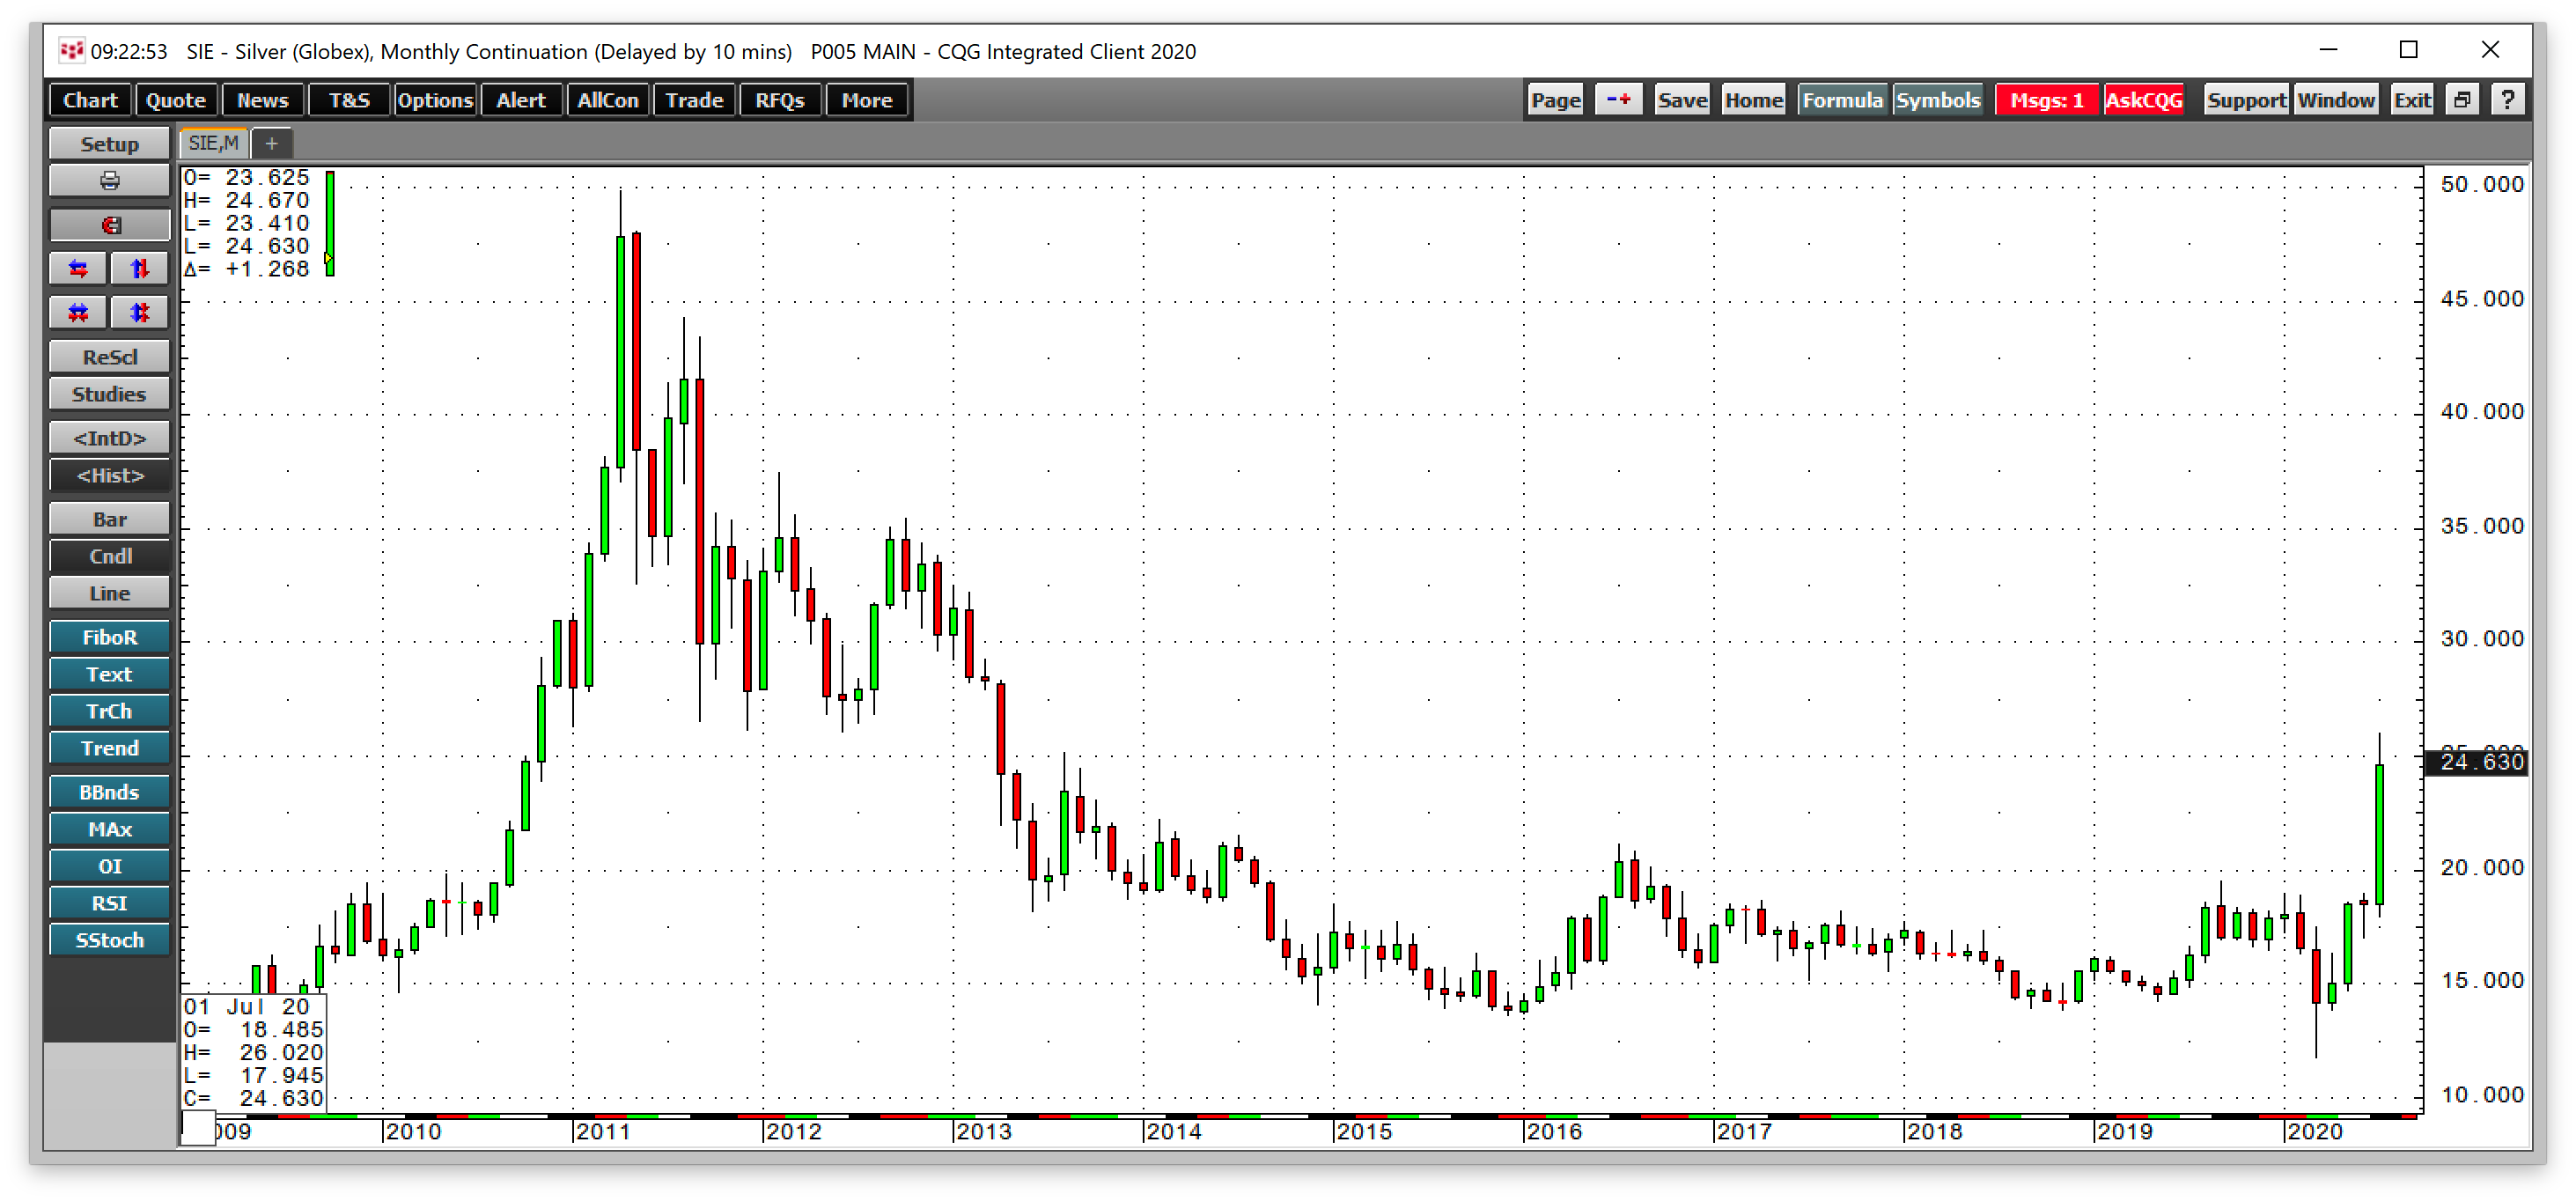
The monthly chart of COMEX silver futures shows that the precious and industrial metal fell below $12 per ounce in March and more than doubled in value by the end of last week with the price over the $24.60 level.
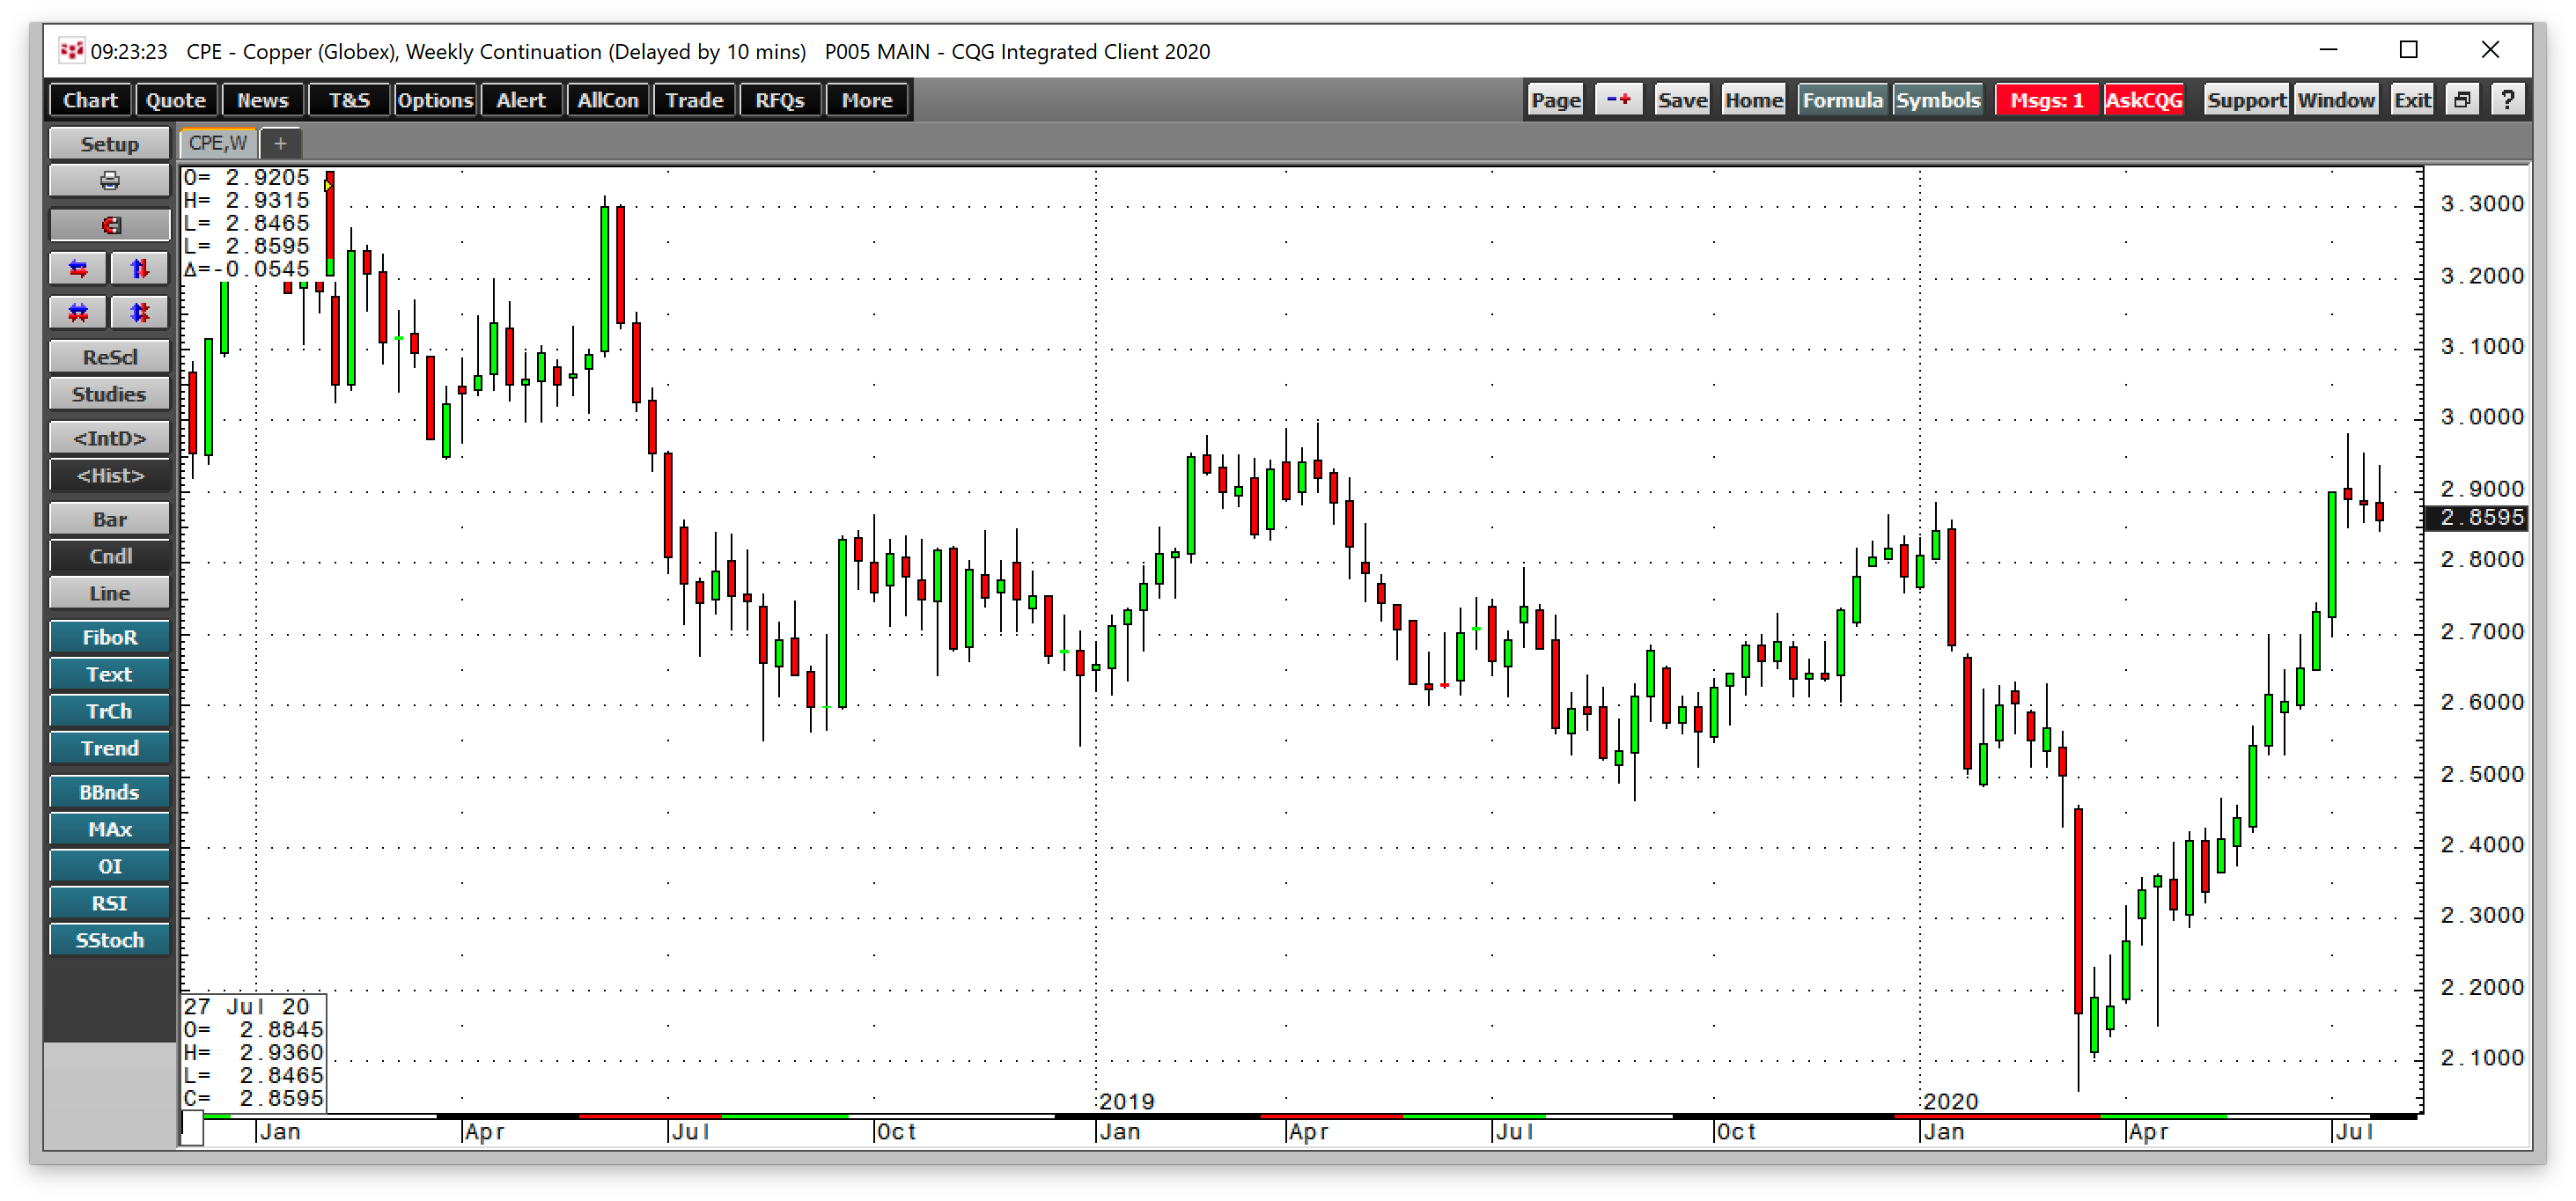
Copper, the red nonferrous metal that is a barometer for the global economy’s health and wellbeing, recovered from below $2.06 per pound in mid-March to over $2.85 as of July 31.
The falling dollar has been a supportive factor for the prices of precious and industrial metals.
Energy and agricultural prices are also sensitive
In April, the price of NYMEX crude oil futures fell into negative territory for the first time since crude futures began trading in the early 1980s.
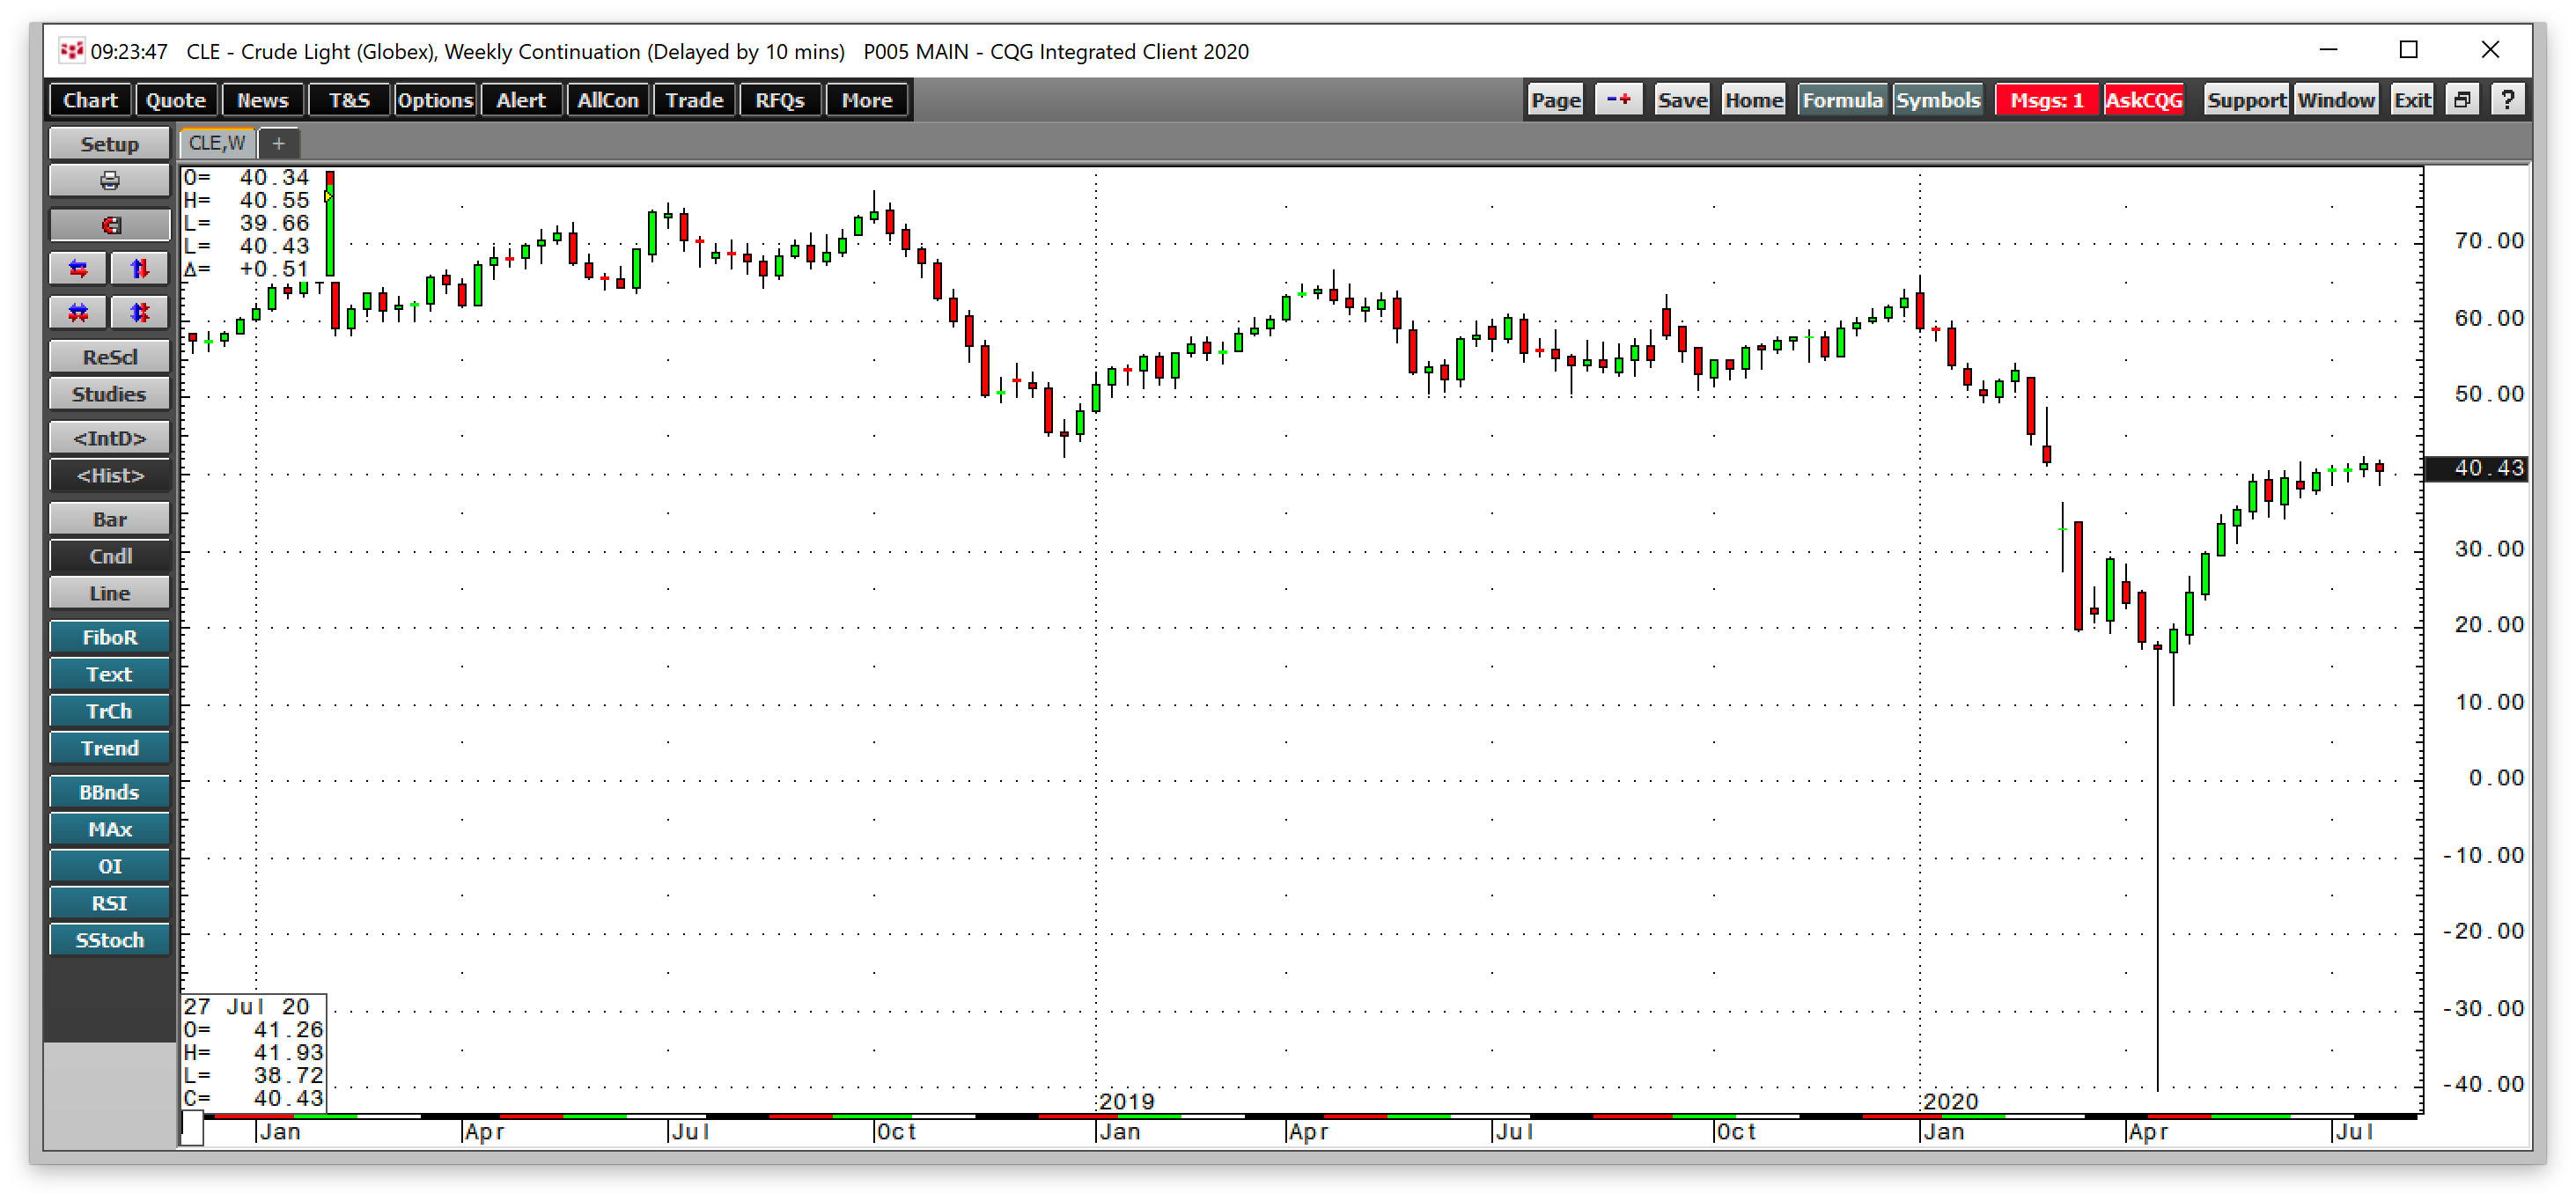
The weekly chart shows an over $80 per barrel recovery from negative $40.32 to over $40 per barrel at the end of last week. While producer quotas and declining output served to balance the fundamental equation in the oil market, the weaker dollar was another factor that boosted the price of the energy commodity.
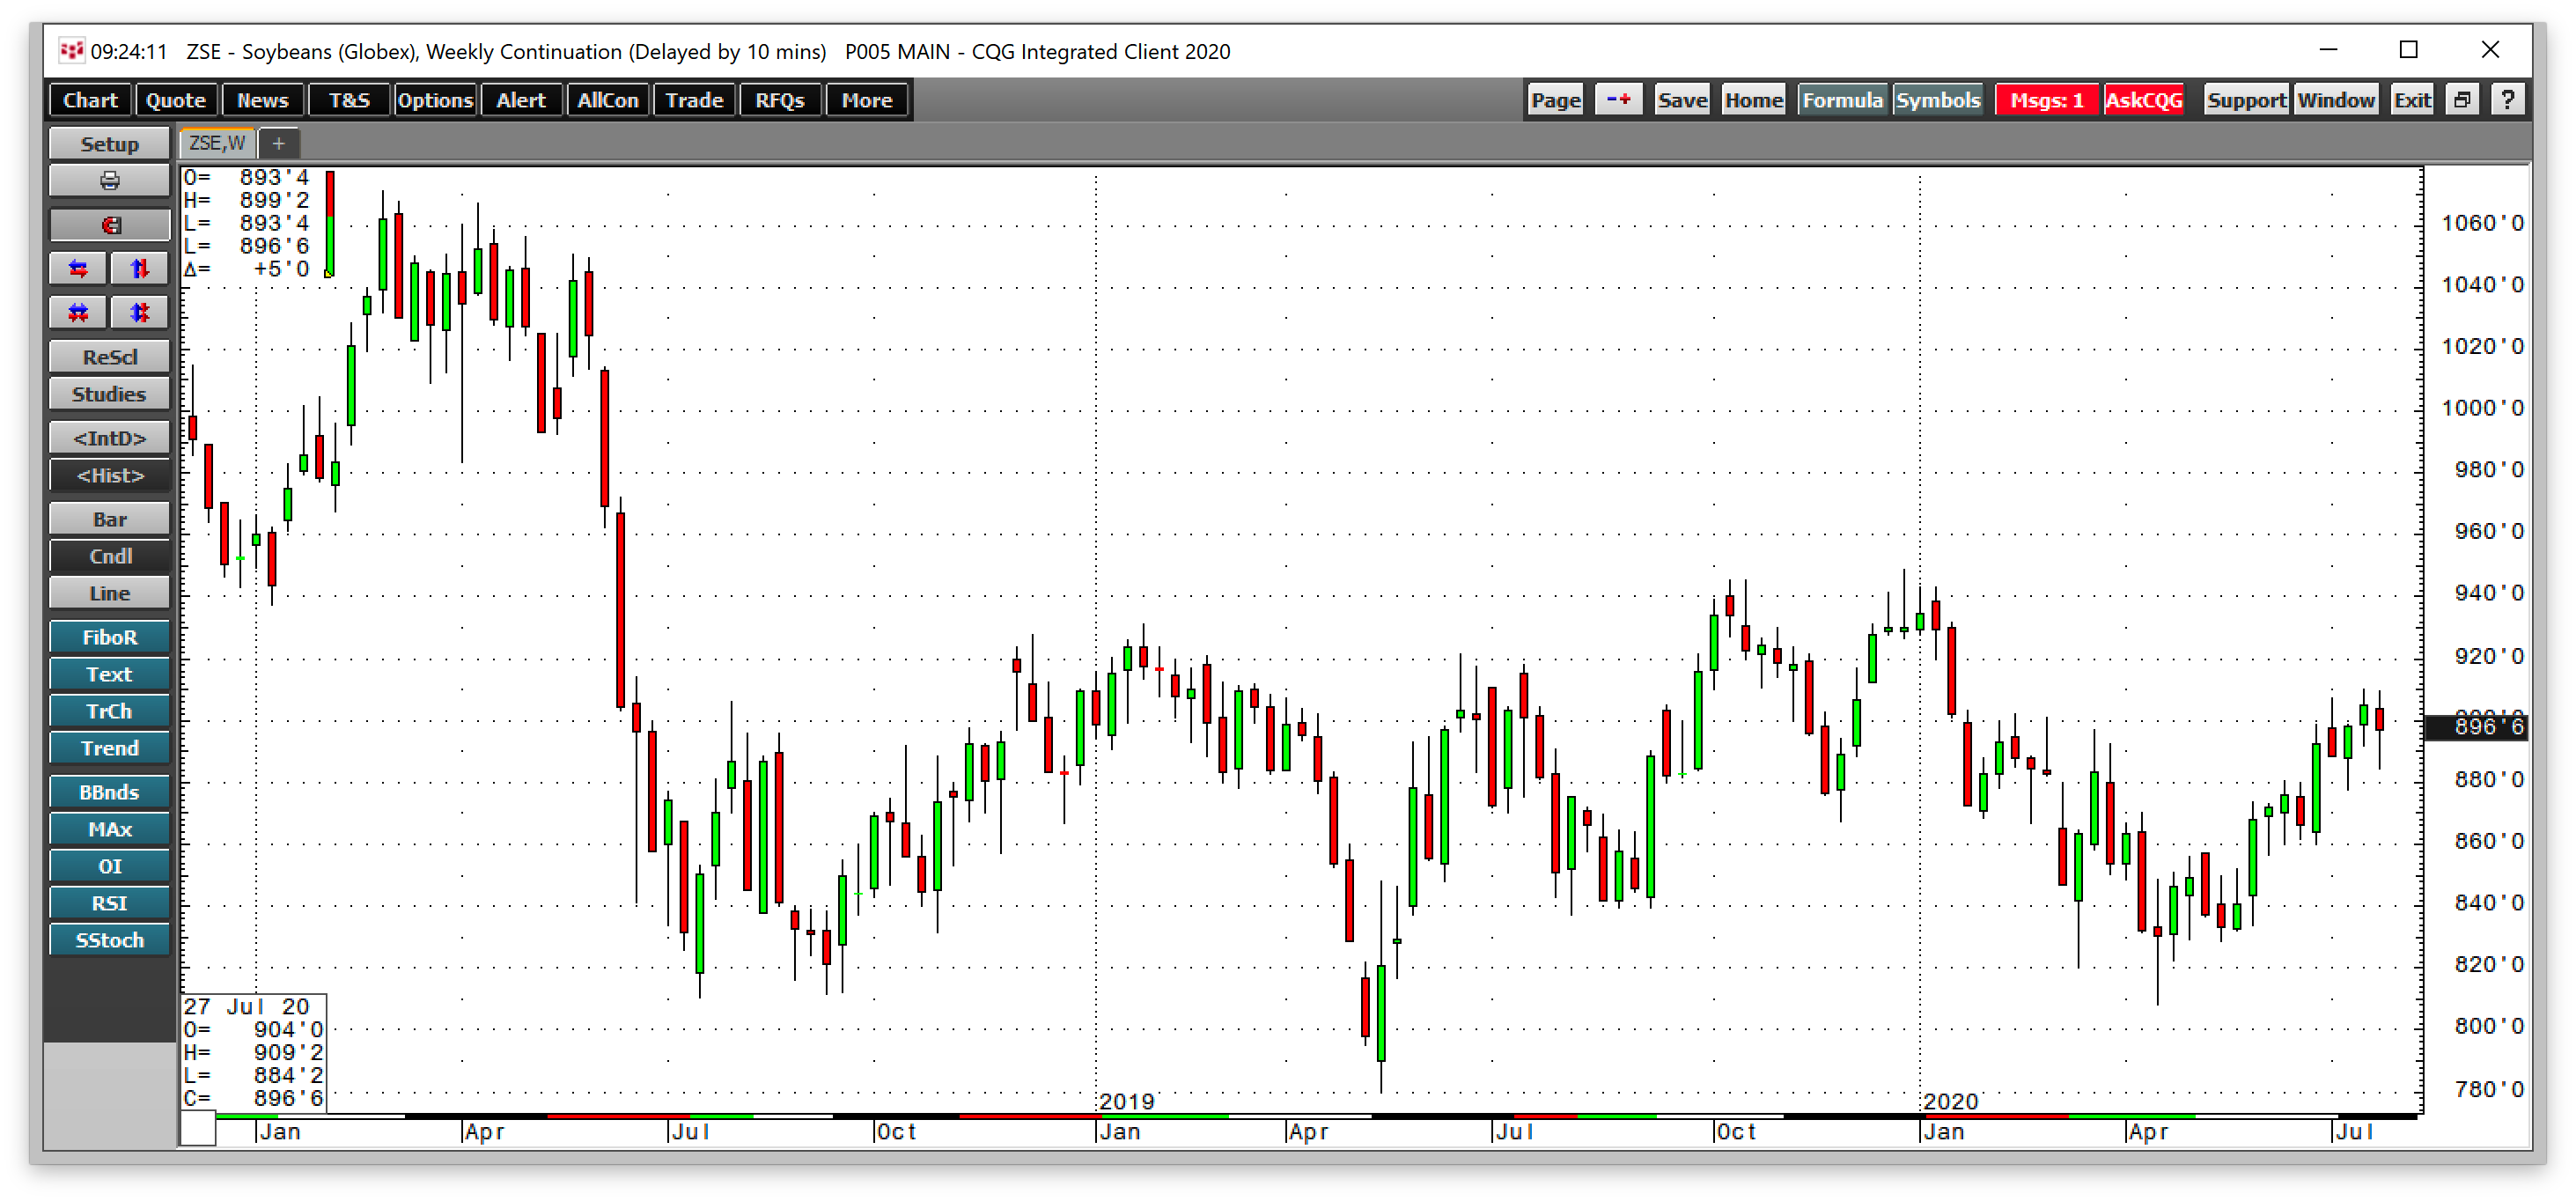
Soybean futures have also moved higher since April. At the same time, corn and wheat futures have also posted recoveries.
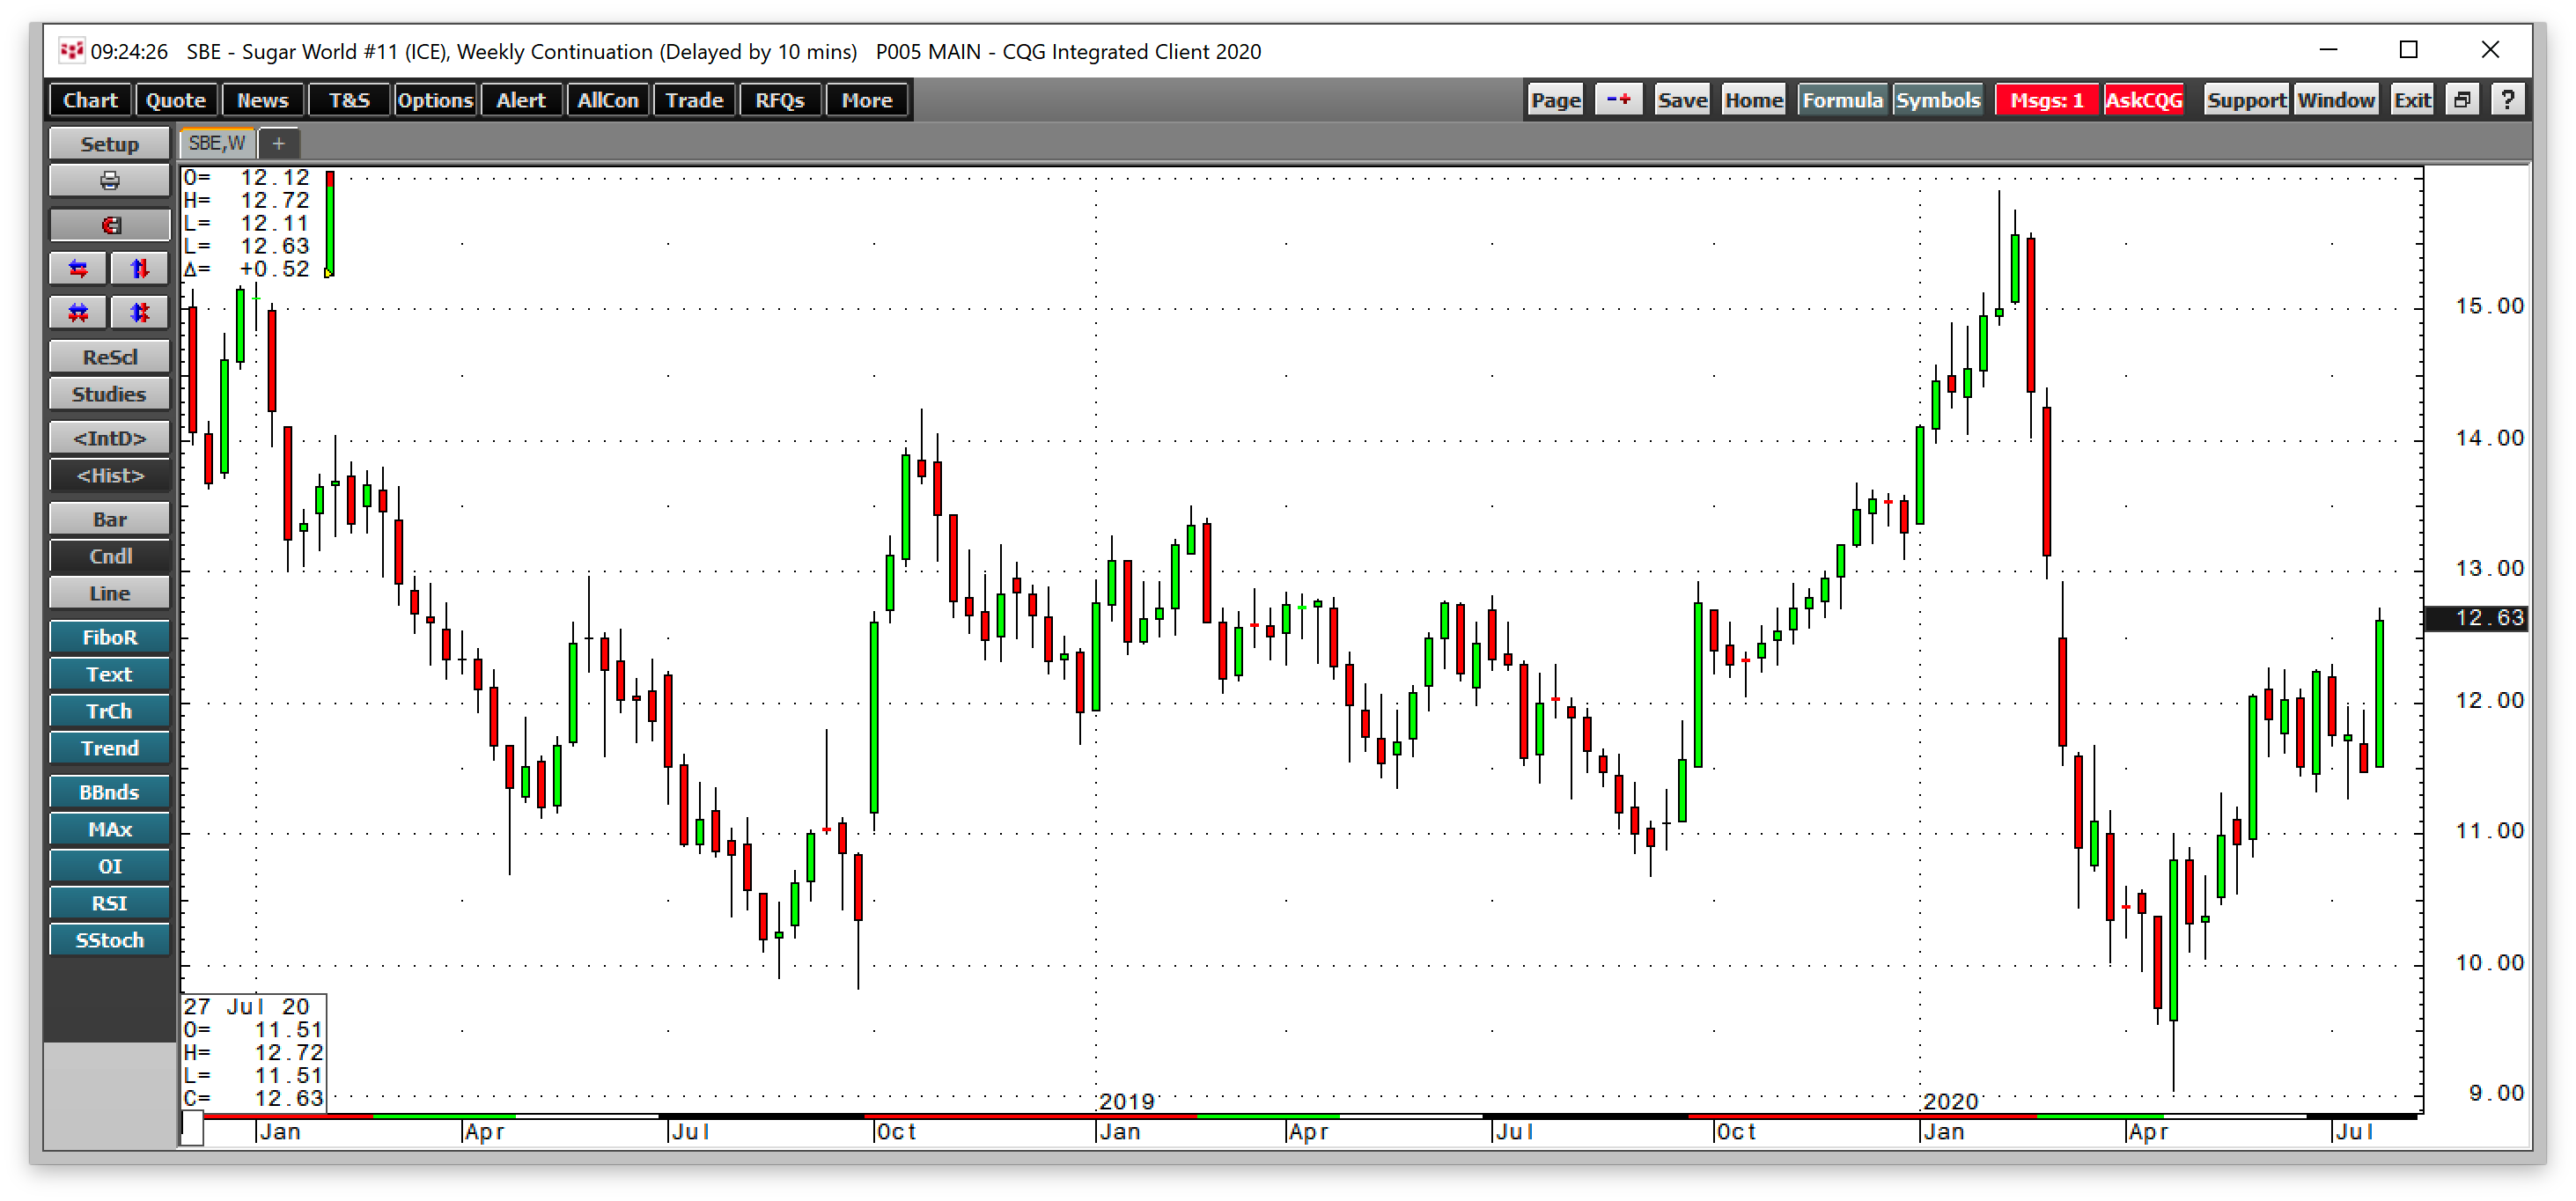
ICE Sugar futures rose from a low of 9.05 cents per pound in April, the lowest level since 2007, to the 12.60 cents level. Energy and agricultural commodity prices have also been finding support with the assistance of a falling dollar.
2008-2011 could be a sign a weaker dollar will turbocharge commodity prices
A combination of a falling dollar and unprecedented monetary and fiscal stimulus levels from central banks and governments creates a potent bullish cocktail for the commodities asset class.
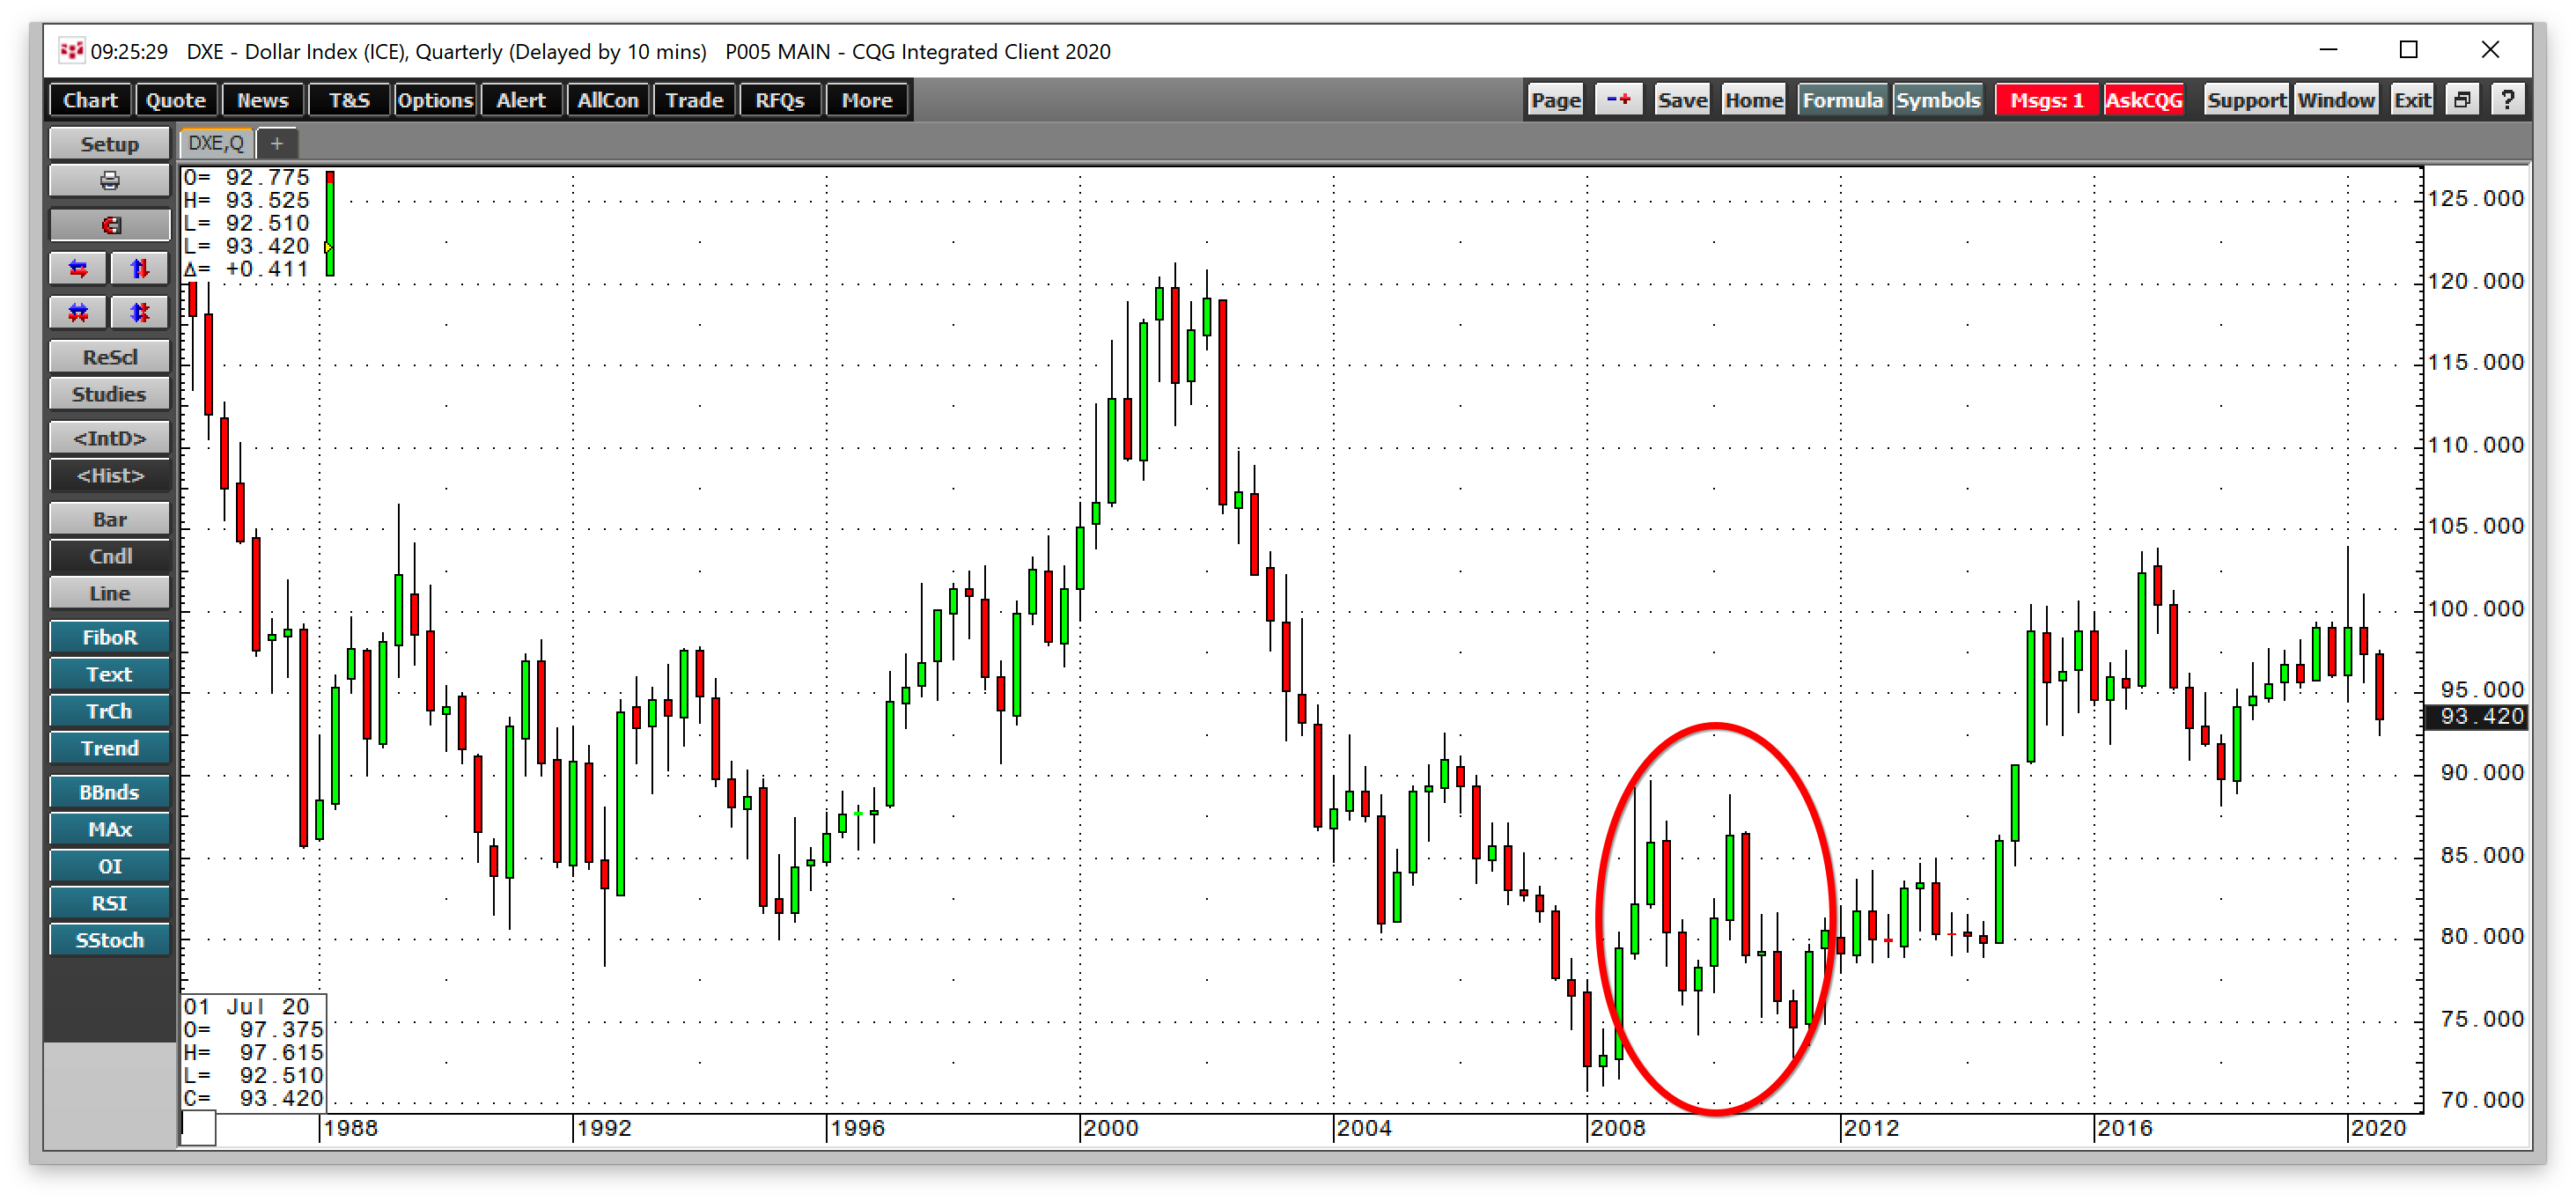
The chart shows that the dollar index fell from a high of 89.71 in early 2009 in the aftermath of the global financial crisis to a low of 72.86 in 2011. Most commodities prices rose to multiyear or all-time highs in 2011 and 2012.
While the path of the Dollar Index is only one factor when it comes to commodity prices, a weak greenback tends to be bullish. We could be on the verge of a substantial rally in the raw materials asset class over the coming months and years.
In 2020, the stimulus levels are far higher than following the financial debacle a dozen years ago. Fasten your seatbelts; commodity prices could be heading a lot higher than most analysts believe possible.
