We've seen quite decent currency moves in recent days. And the market wasn't exactly asleep on Wednesday. Let's put these moves into pictures. The implications lead us to make serious decisions. Is there a more pleasant sound than ringing a cashier's bell? Ringing YOUR cashier's bell, that is. Just see what we've exactly decided to do right now.
EUR/USD - Resisting At Support?
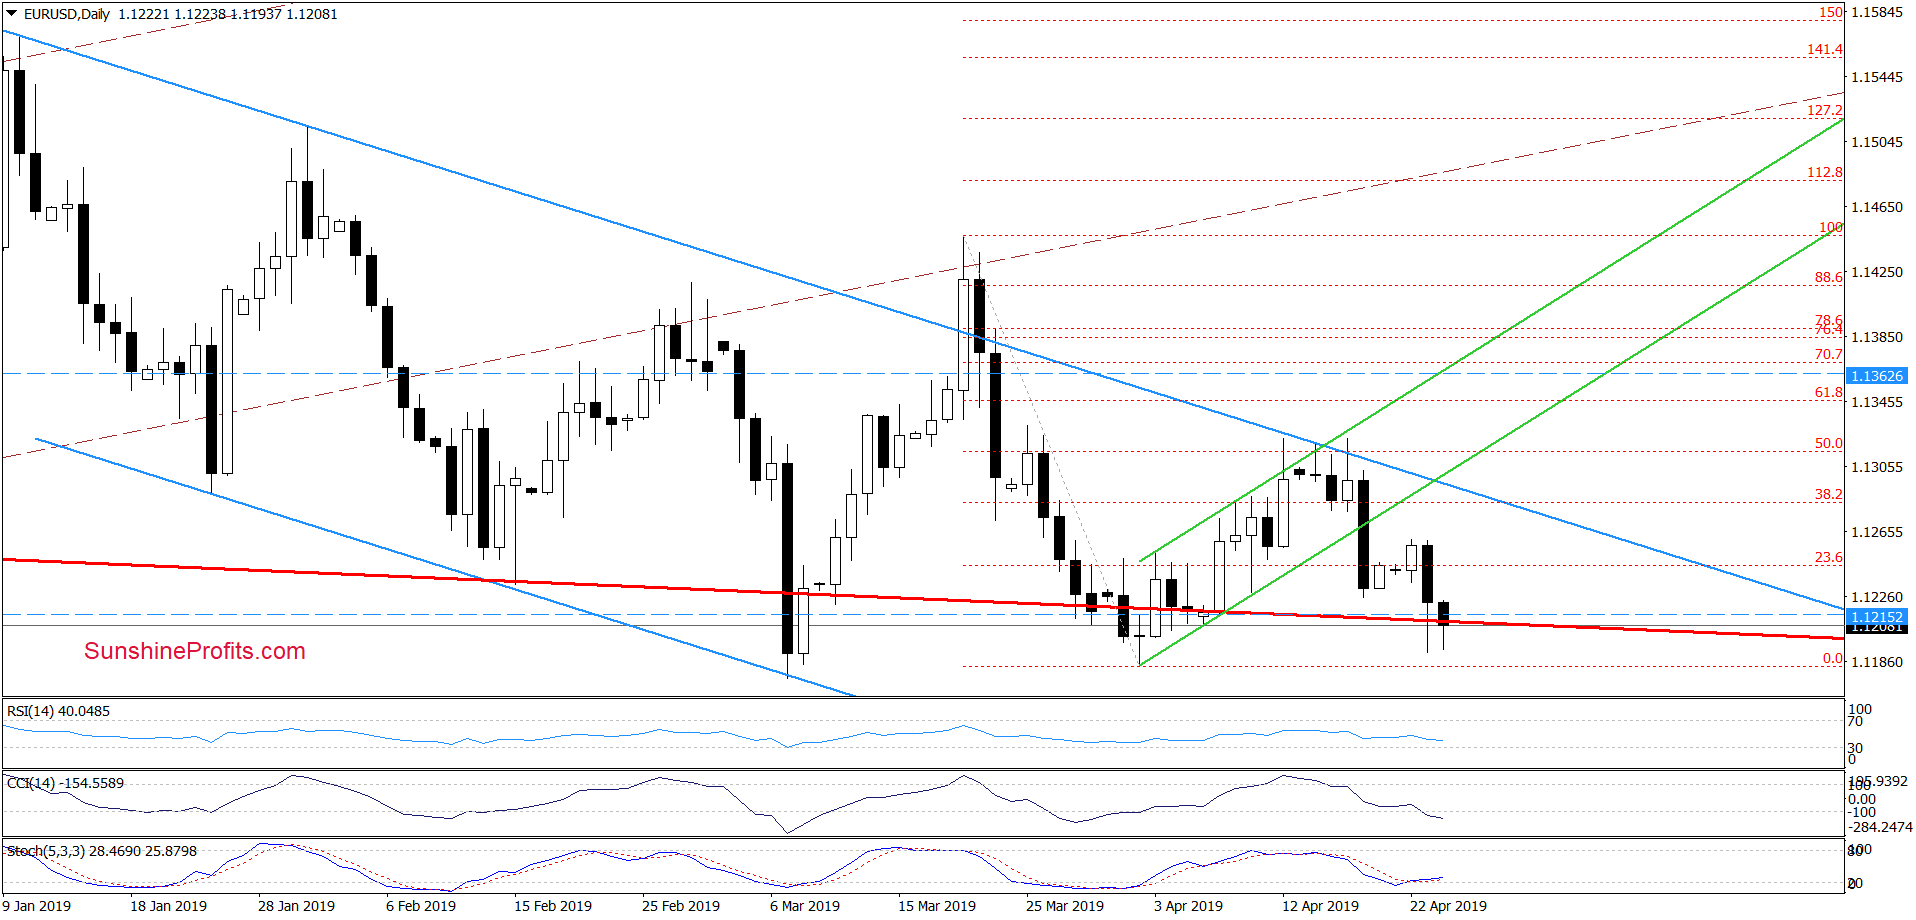
On Thursday, we wrote these words about the profitable EUR/USD move lower:
(...) If this is the case, a test of the red support line (the lower border of the long-term red declining trend channel) would follow
The situation developed in line with the above and EUR/USD slipped below the declining red channel during yesterday's session. The bulls have brought the rate back from the abyss before the close, however. The earlier breakdown has thus been invalidated.
Earlier today, currency bears returned to the trading floor. The exchange rate moved below the red line once again, making our short positions even more profitable.
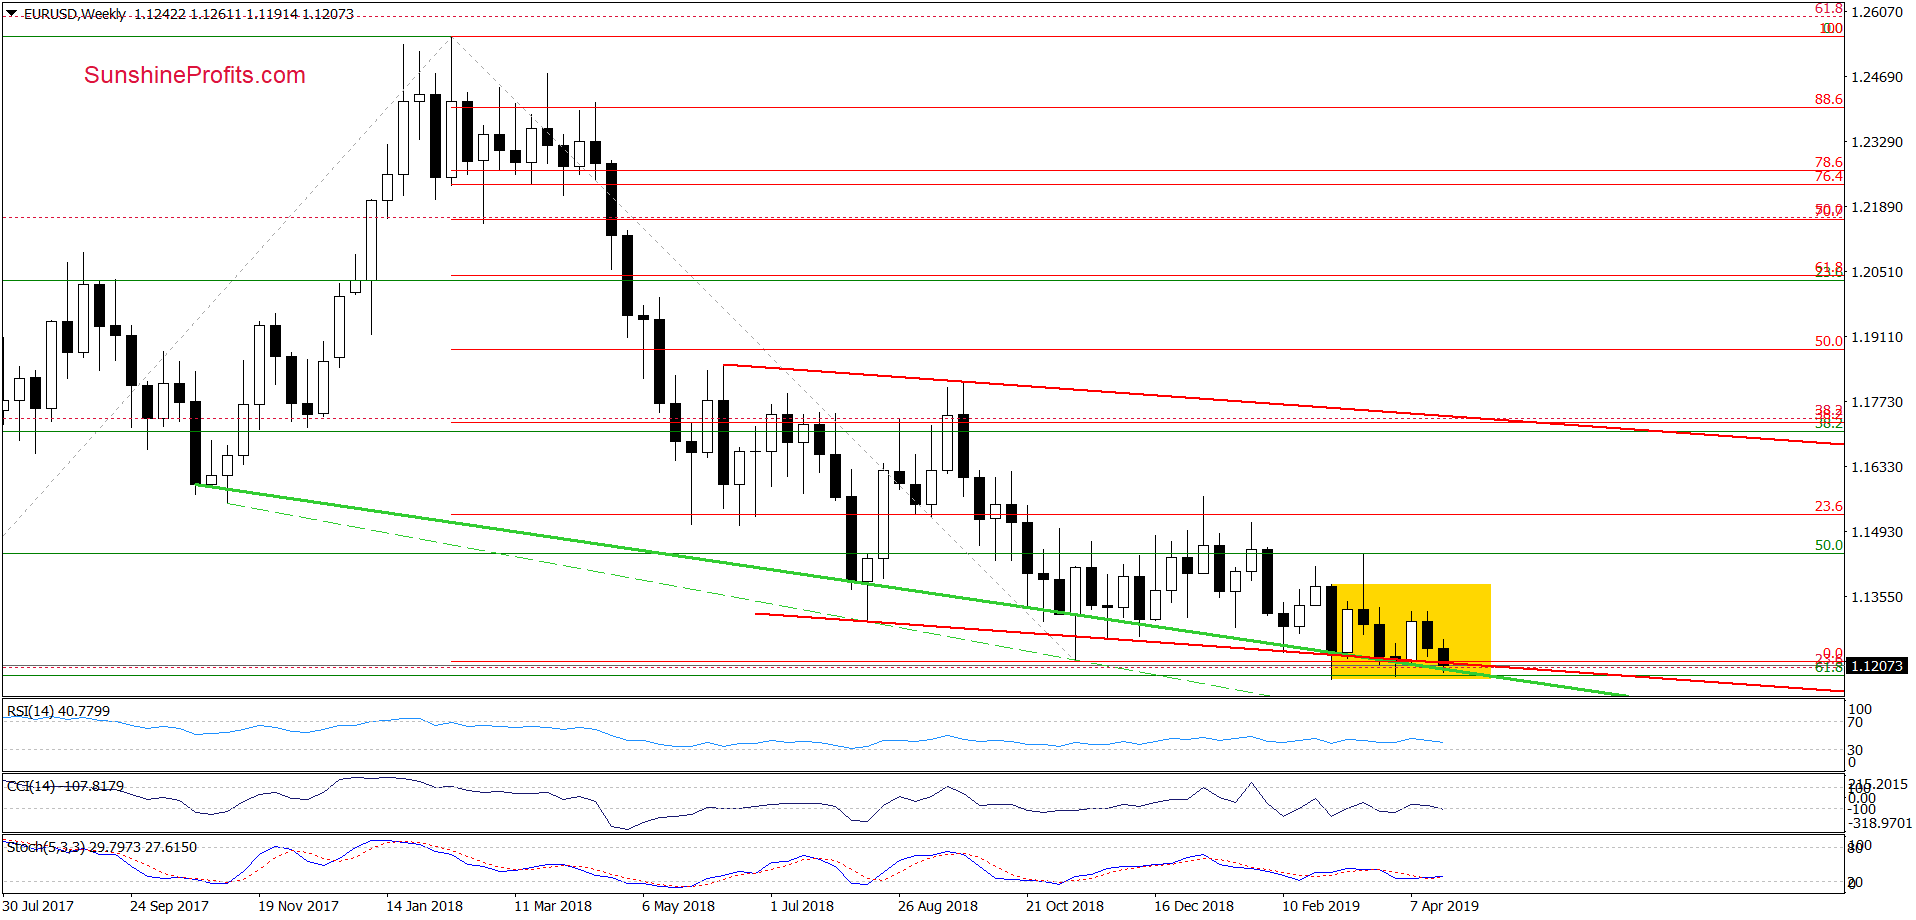
Let's take now into account the current position of the daily indicators, the proximity to the early-April and March lows and the long-term green support line seen on the weekly chart (below). We think it prudent to close a reasonably high part of our short positions and take profits off the table (as a reminder, we opened them when EUR/USD was trading at around 1.1295). This is justified from the risk/reward perspective. We leave the remainder of our short positions in the market with a new take-profit and stop-loss order. Full details are reserved for our subscribers.
USD/CHF - On Verge Of Declining?
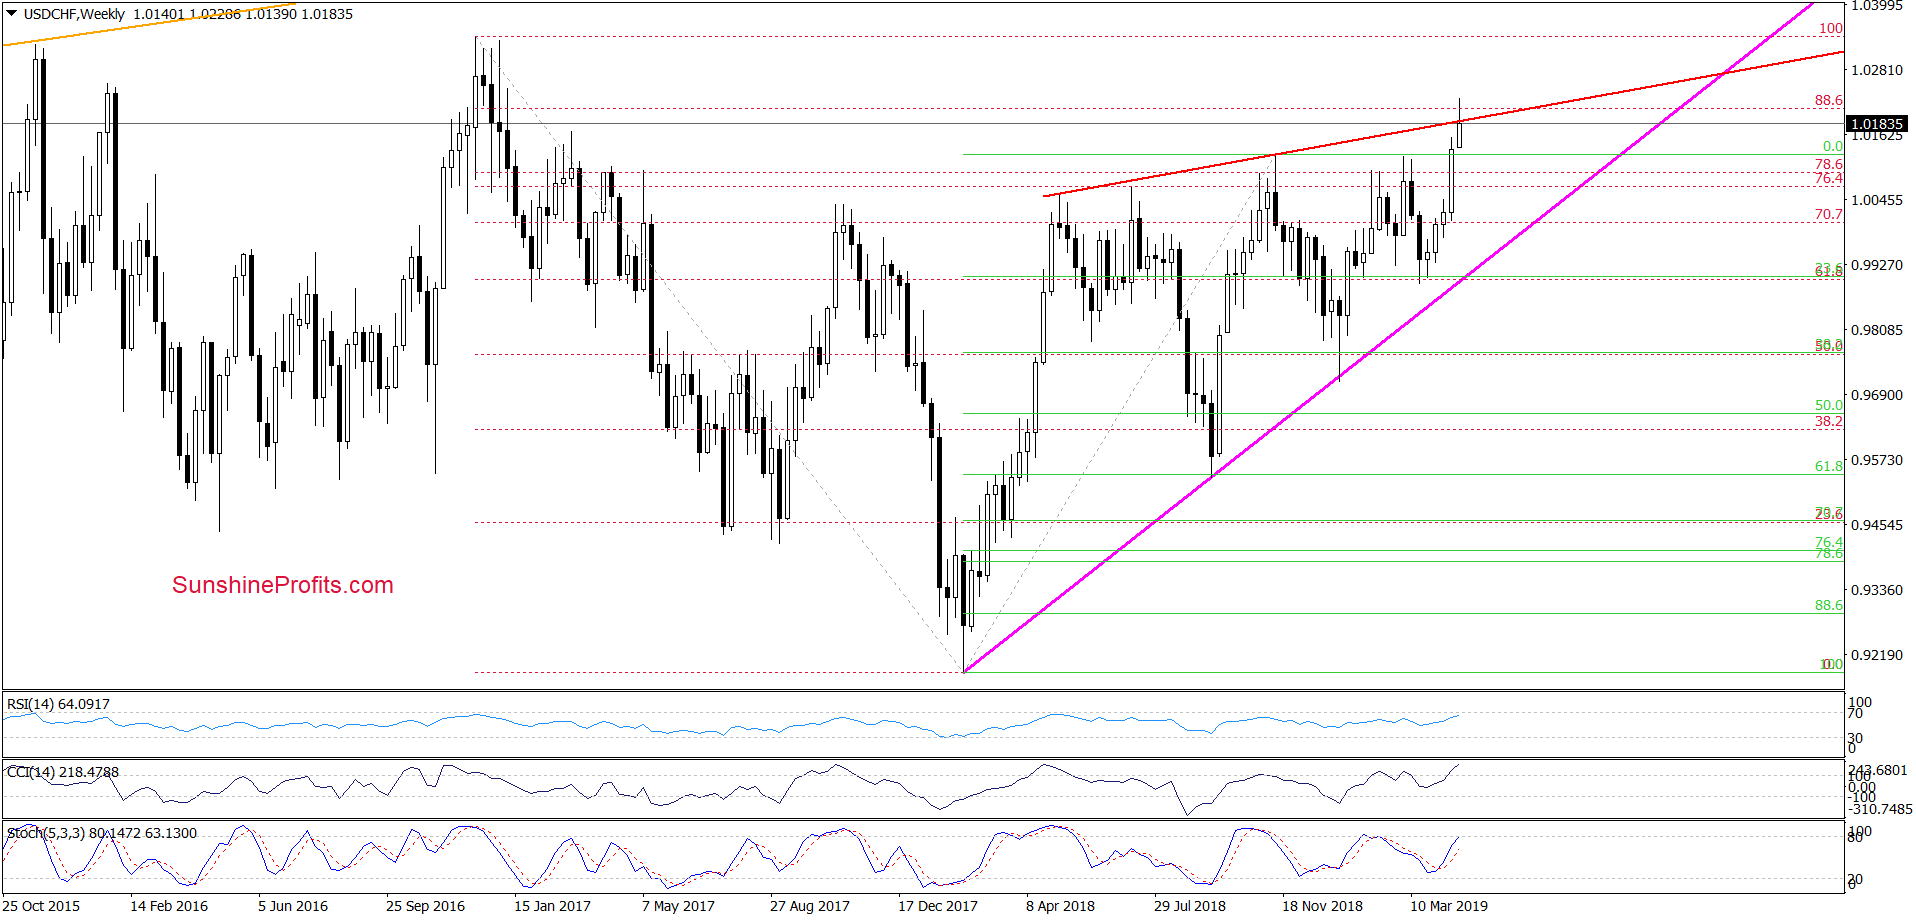
The weekly chart shows that USD/CHF has extended gains. It has climbed not only above the 88.6% Fibonacci retracement, but also above the red rising resistance line based on the previous peaks.
This improvement was quite temporary and the exchange rate slipped back below both resistances. The earlier breakouts were thus invalidated. In the process, the pair also invalidated the breakout above the 141.4% Fibonacci extension as seen on the daily chart below.
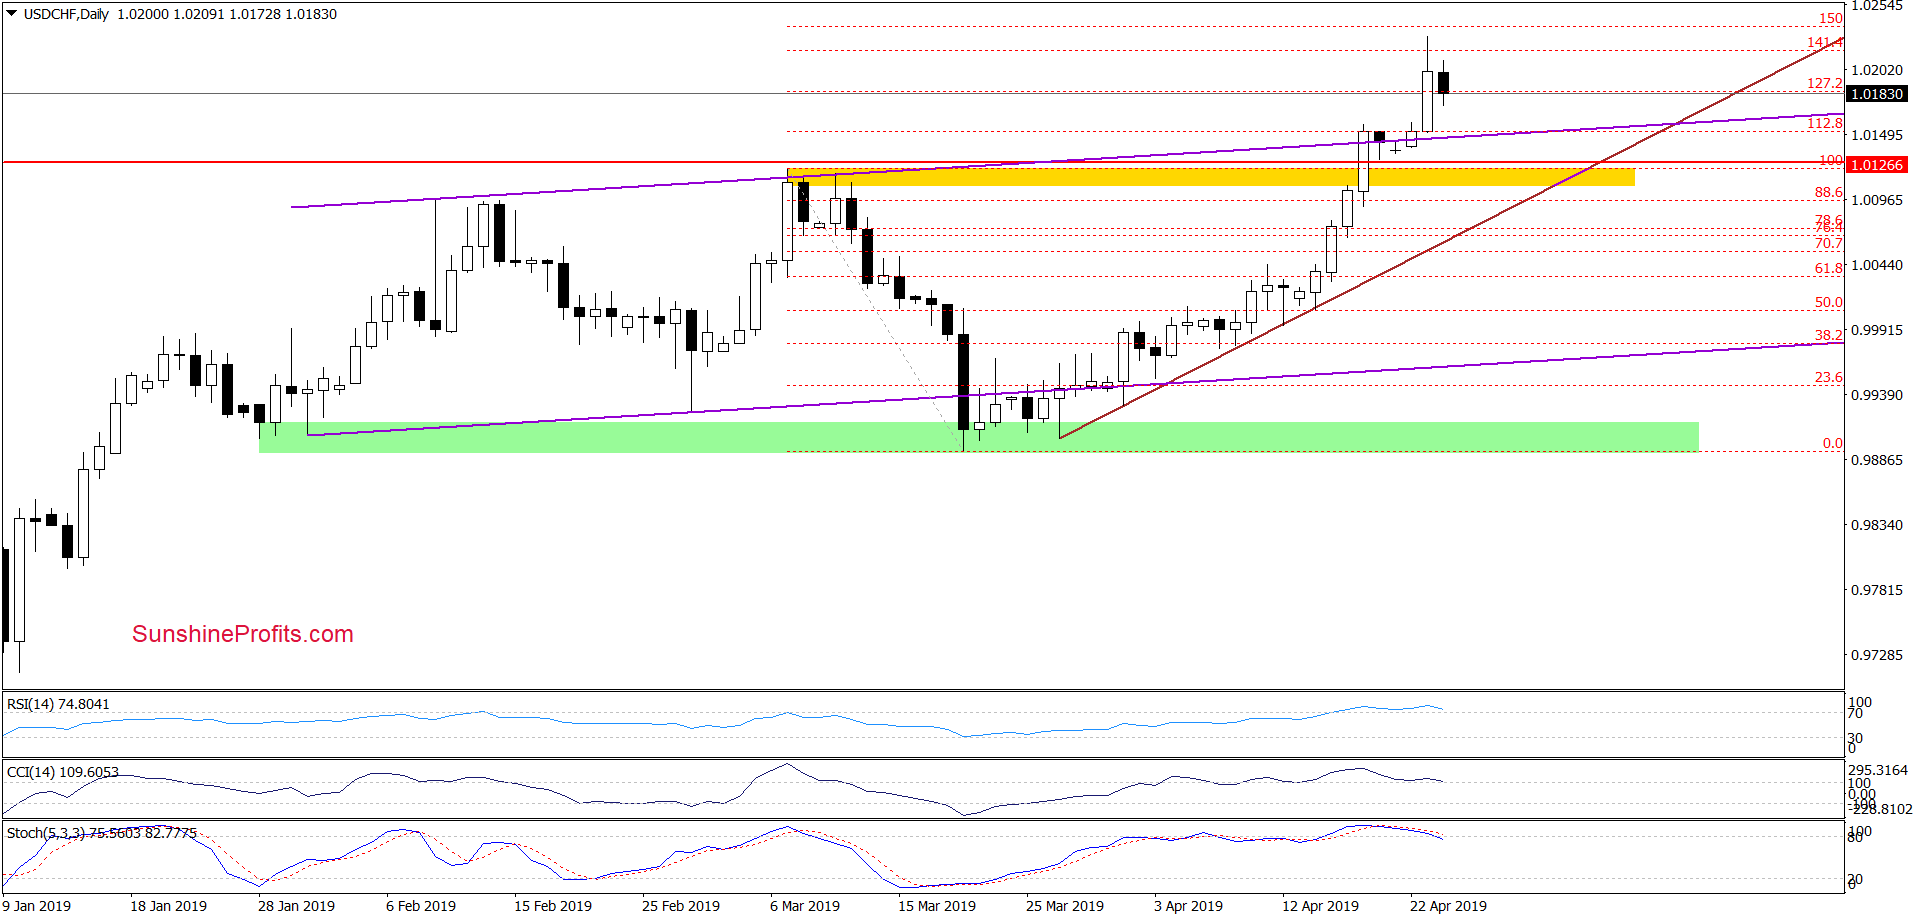
Additionally, the Stochastic Oscillator just flashed a sell signal, while the RSI and the CCI are very close to doing the same. Taking all the above into account, it seems likely that USD/CHF will extend losses from here. The bears will probably test the previously-broken upper border of the purple rising trend channel in the very near future.
AUD/USD - Where To After Next Breakout Invalidation?
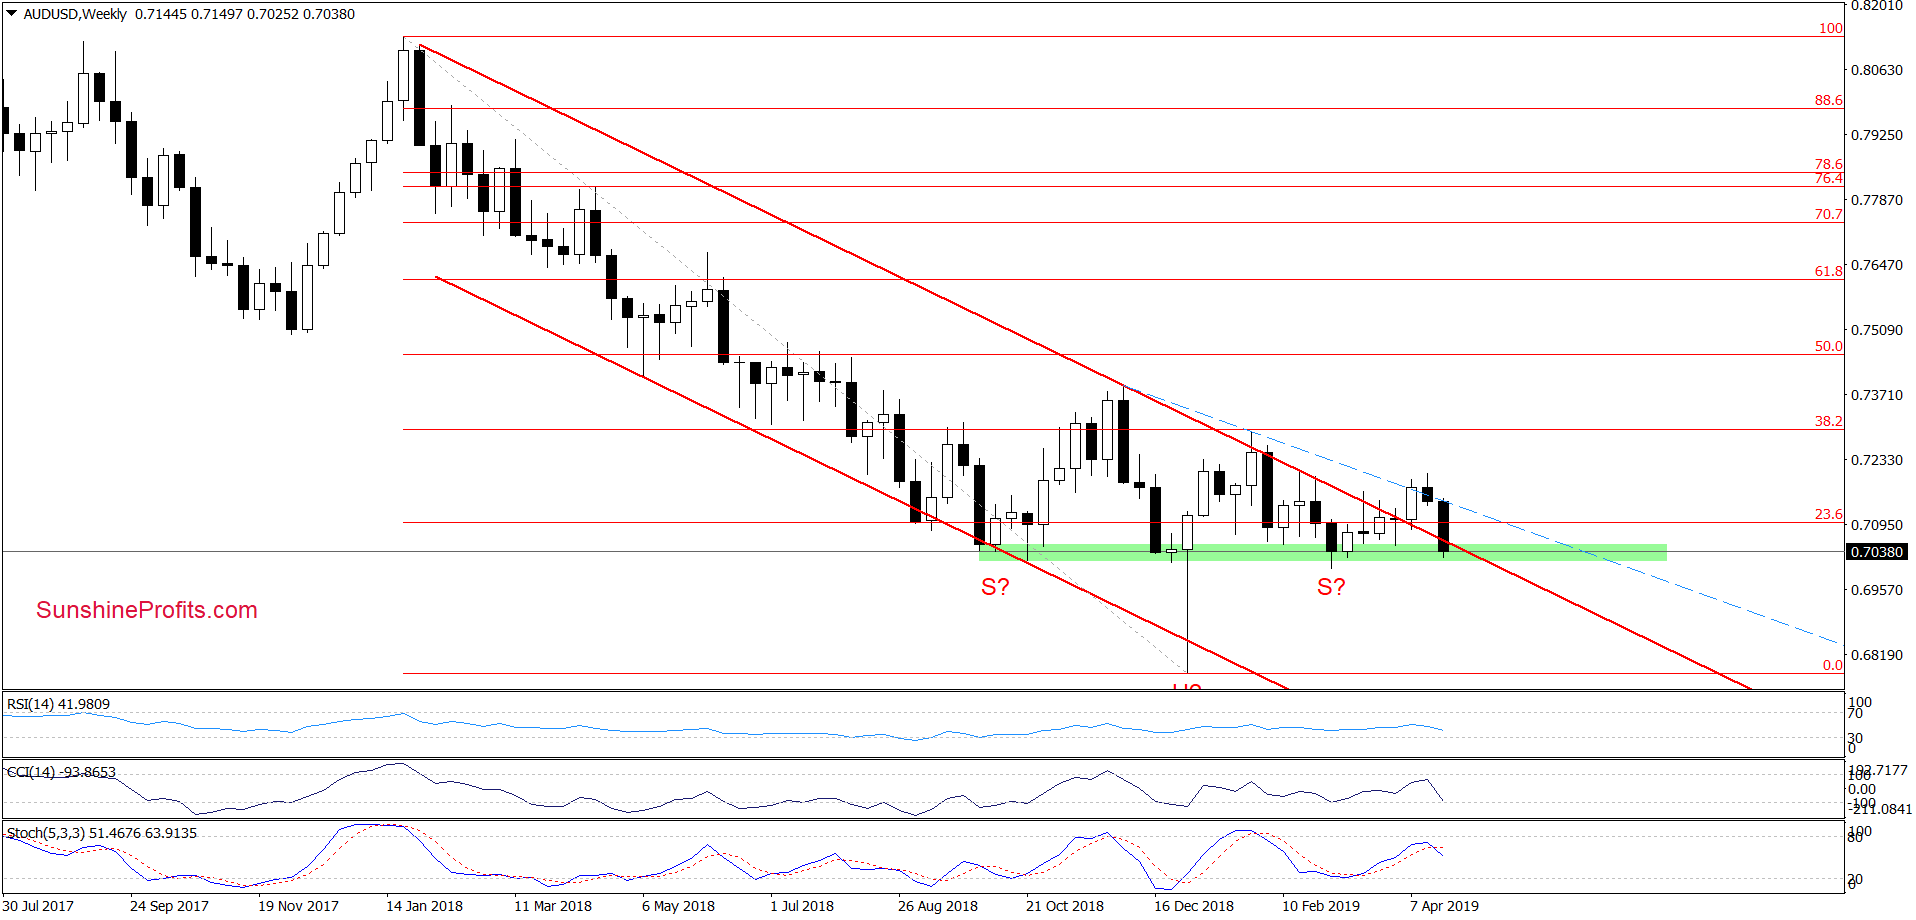
Let's start with the weekly perspective. The first thing that catches the eye is an invalidation of the earlier breakout above the upper border of the red declining trend channel.
This is a bearish development. The currency bears pushed AUD/USD sharply lower and took the pair to the green support zone again. Additionally, the Stochastic Oscillator generated a sell signal, increasing the probability of further deterioration in the coming week(s).
Let's see how all these reflect in the daily chart now.
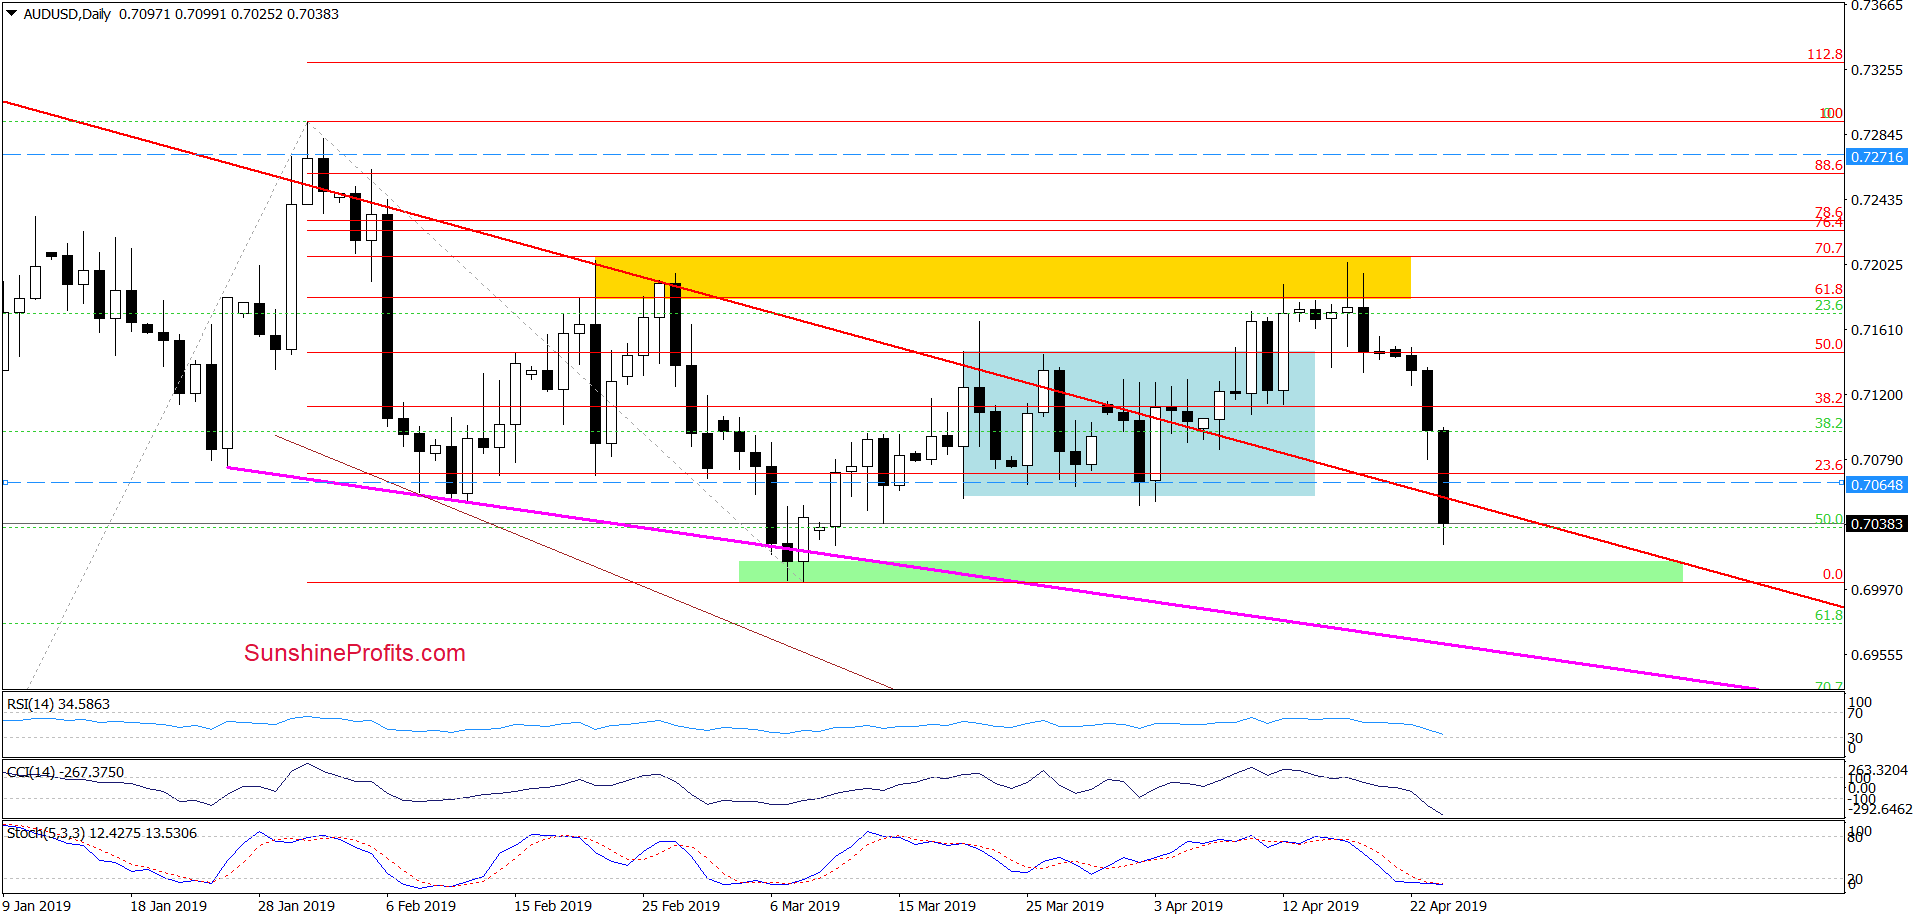
The situation for the bulls doesn't seem that hopeless on the daily chart.
The CCI and the Stochastic Oscillator moved to their oversold areas, which in combination with the proximity to the green support zone could translate into a rebound in the following days.
Taking the above into account, we think that closing a reasonably high part of our short positions and taking profits off the table (as a reminder, we opened them when AUD/USD was trading at around 0.7153) is justified from the risk/reward perspective. We leave the remainder of our short positions in the market with a new take-profit and stop-loss order. Full details are reserved for our subscribers.
Thank you.
