NVDA Q3 Earnings Alert: Why our AI stock picker is still holding Nvidia stockRead More

Euro Continues To Look Over The Edge

Published 10/30/2015, 10:10 AM
Updated 05/14/2017, 06:45 AM
EUR/USD
-

2015 began as the euro had come from 140 to 110 during 2014. Indeed, the last few months of last year saw a quick move lower. If you remember, the catalysts were a weakening European economy in general and Greece in particular. (Side note: I wonder why we never hear of trouble in The Dominican Republic sinking the global economy?). The FOMC had also announced its intention to end monetary support of the US economy (read, stock market).

What has happened to the euro since then? Basically nothing. It has stayed in a tight range from 107.50 to 112.50 with a few brief forays outside of the range, which quickly reverted. But doing nothing actually has some meaning to a technician.
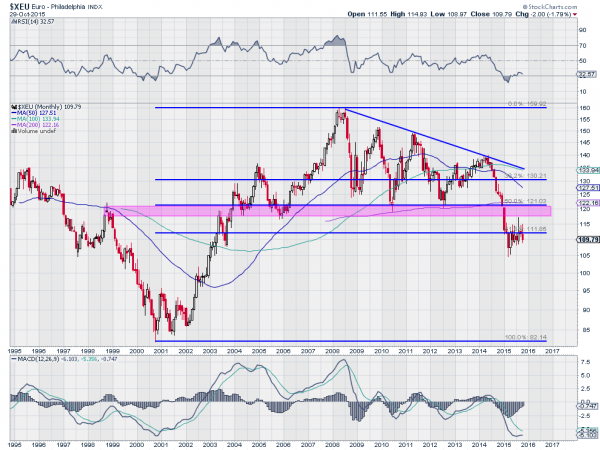
The Euro

The chart above explains why. From its low in 2000 to its high in 2008, the euro moved over 65%. But since then, the fall back has been in play. The price of the euro broke out of a consolidating formation, a descending triangle, at the end of 2014. That formation would target a move lower in the currency to 83. That would be a full retracement of the move higher.

The stall that we have seen in 2015 does not preclude that from happening. It is occurring at the 61.8% retracement of the move up -- a key level for traders, a Fibonacci ratio. Many would expect a battle at this level between traders who believe the currency is oversold and those who think the objective lies below. This has created yet another pattern for technicians, a bear flag.

The slight counter-trend move in the euro all through 2015 shows consolidation, but also a weak attempt to move higher. Essentially, profit taking from short holders, but not any real strength in buying. The bear flag gives another look at the technicals and a break to the downside as a resumption of the move targets the low 80’s. Coincidence?

Continue to keep the euro on your radar. Any prolonged stay under 110 will be a sign of continuing weakness. A move back over 115 would indicate that buyers are stepping in. The former would be a plus for US stocks, the latter is not as clear.

Original post

Latest comments

Loading next article…
Risk Disclosure: Trading in financial instruments and/or cryptocurrencies involves high risks including the risk of losing some, or all, of your investment amount, and may not be suitable for all investors. Prices of cryptocurrencies are extremely volatile and may be affected by external factors such as financial, regulatory or political events. Trading on margin increases the financial risks.
Before deciding to trade in financial instrument or cryptocurrencies you should be fully informed of the risks and costs associated with trading the financial markets, carefully consider your investment objectives, level of experience, and risk appetite, and seek professional advice where needed.
Fusion Media would like to remind you that the data contained in this website is not necessarily real-time nor accurate. The data and prices on the website are not necessarily provided by any market or exchange, but may be provided by market makers, and so prices may not be accurate and may differ from the actual price at any given market, meaning prices are indicative and not appropriate for trading purposes. Fusion Media and any provider of the data contained in this website will not accept liability for any loss or damage as a result of your trading, or your reliance on the information contained within this website.
It is prohibited to use, store, reproduce, display, modify, transmit or distribute the data contained in this website without the explicit prior written permission of Fusion Media and/or the data provider. All intellectual property rights are reserved by the providers and/or the exchange providing the data contained in this website.
Fusion Media may be compensated by the advertisers that appear on the website, based on your interaction with the advertisements or advertisers.
© 2007-2024 - Fusion Media Limited. All Rights Reserved.