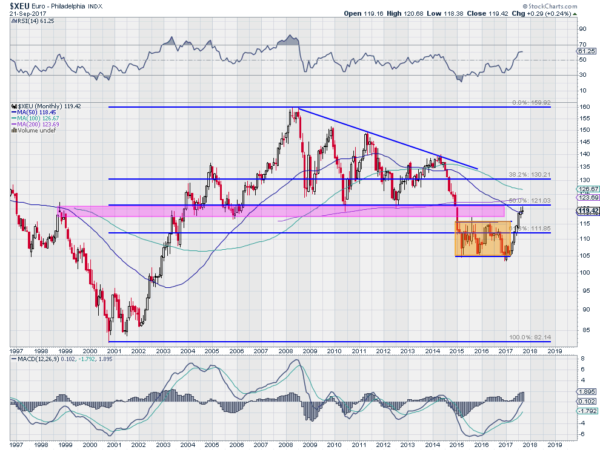
The euro has received a lot of attention since the Brexit vote nearly 15 months ago. Yes it was over a year ago that Britain voted to leave the EU. Nothing happens fast in politics overseas either. For its part, the euro has basically shrugged off the rhetoric from a long-run perspective. A move lower found support where it had before the vote and then a reversal higher. It was 3 months ago, the anniversary of the vote, when it got interesting again.
The chart below explains why. This is a long-term monthly euro chart going back 20 years. The first thing to note is the strong run higher that began in earnest in 2002. It peaked in 2008 and began a consolidation in a descending triangle that lasted 7 years before it broke to the downside. It continued lower and settled into a range for the next 2 years. A false break down out of the range was quickly erased and it has moved higher since.

Which brings us to today. With one week left in September, the euro is back at the triangle breakdown level and its 50-month moving average, as it moves in a tight range. This has been the case for almost 7 weeks. The small range at what was support and is now resistance is indicative of indecision. But which way will it resolve — to the upside or back lower?
Momentum has been on the side of continuation higher. But it too is at reflexive levels. The MACD is rising, but just breaking to positive. The RSI is also just cracking over 60 into bullish territory. These need to continue higher to support more upside. For the moment, we must side with the current trend higher. But consider its continuation suspect until it can get and close above 123.50. A move back under 116 would indicate a failed break higher.
