A good week to go long
Beta risk made everyone look brilliant last week. Not a bad way to start a long US holiday weekend.
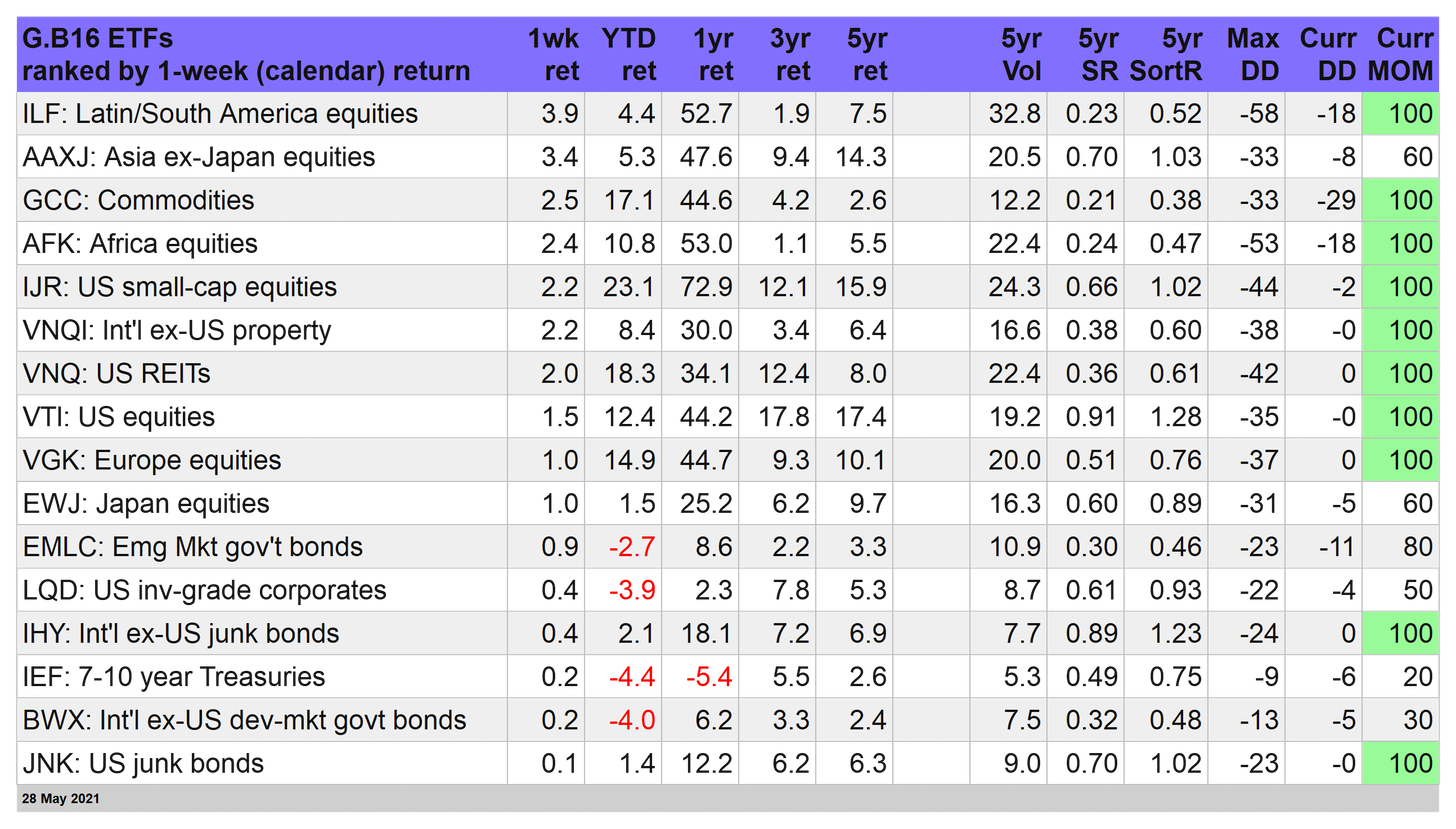
No matter where you turned, markets posted gains the past week, based on our standard 16-fund global opportunity set through today’s close (Friday, May 28). Shares in iShares Latin America 40 ETF (NYSE:ILF) and iShares MSCI All Country Asia ex Japan ETF (NASDAQ:AAXJ) led the way.
The weakest performance: US junk bonds—SPDR® Bloomberg Barclays High Yield Bond ETF (NYSE:JNK), but there was enough buying activity in this corner to eke out a gain. For details on all the strategy rules and risk metrics, see this summary.
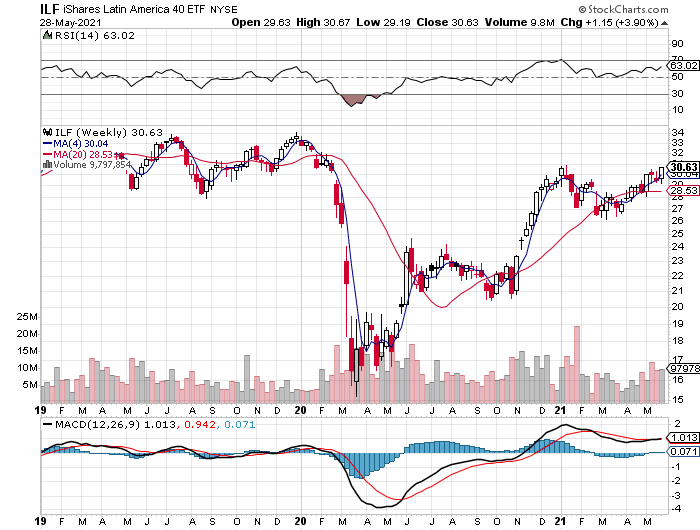
The iShares Latin America 40 (ILF) was the top performance, ramping up 3.9% for the week. The rally lifted the fund to the highest close since mid-January. Friday's session lifted the fund to just below the previous peak and so this week looks set to be a test.
If the fund can break still-higher ground for 2021, the bullish momentum will look more convincing, suggesting that ILF will recover its pre-pandemic high this summer.
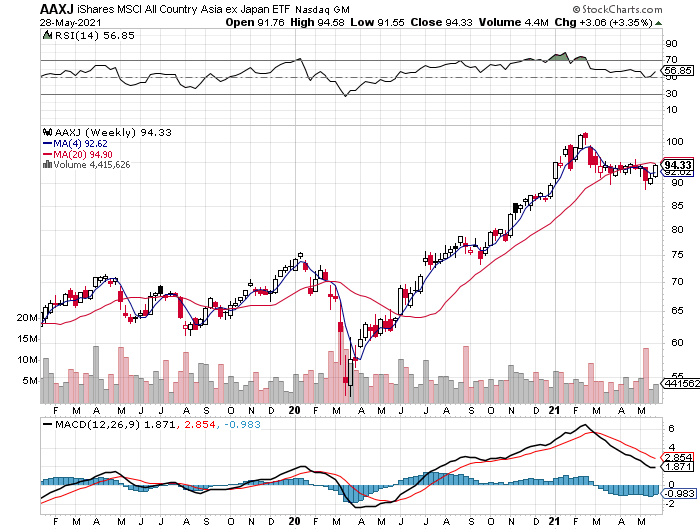
A strong second-place finish last week: iShares MSCI All Country ex-Japan (AAXJ), which rallied 3.4%. The momentum trend for the fund still looks mixed, but with two weeks of gains there may be a recovery brewing after several months of treading water—watch this space.
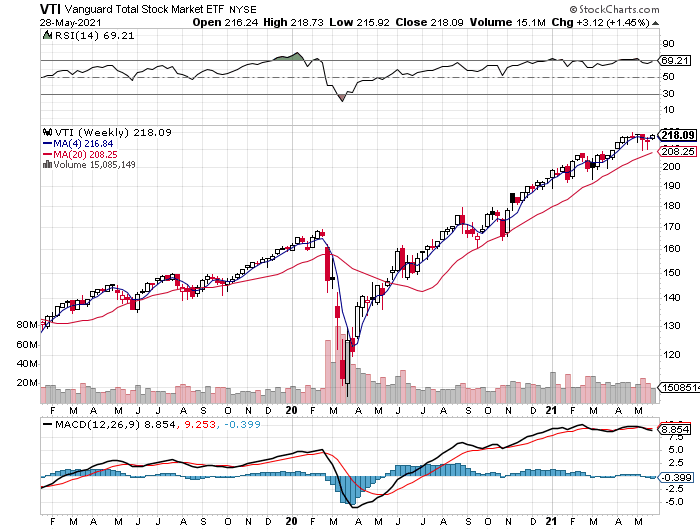
US stocks logged the first weekly advance in the past three. Vanguard Total Stock Market Index Fund ETF Shares (NYSE:VTI) rose 1.5%.
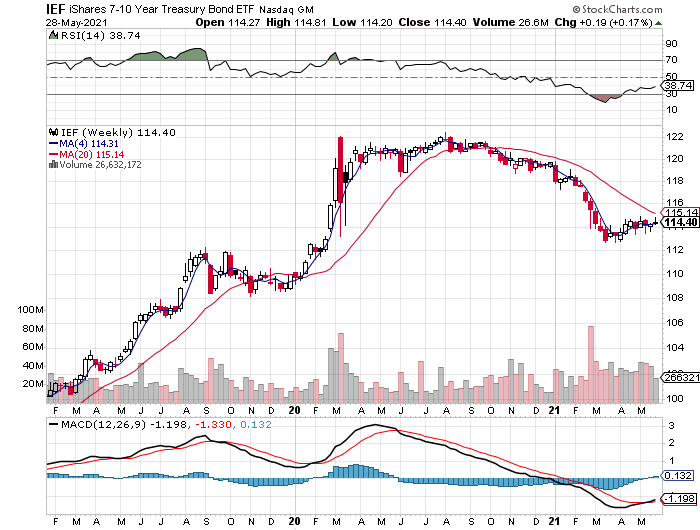
US Treasuries also managed to post a second straight weekly gain: iShares 7-10 Year Treasury Bond (NYSE:IEF) edged up 0.2%. The upside potential still doesn’t look convincing, but downside risk isn’t particularly compelling at the moment either.
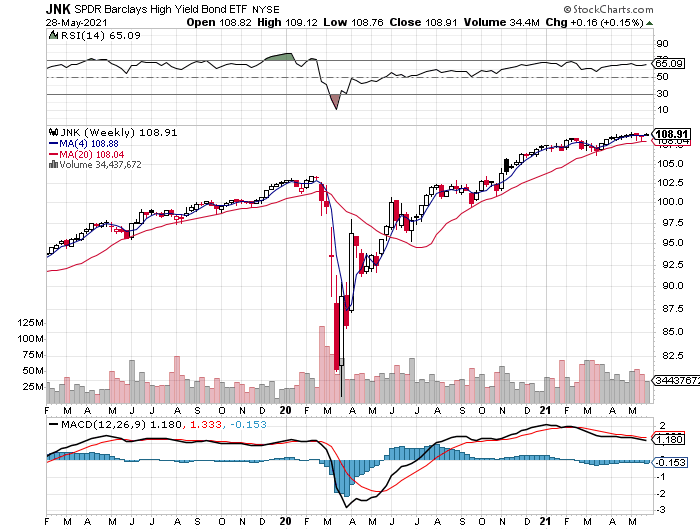
SPDR Barclays US High Yield Bond (JNK) was the weakest gainer last week, but here too it wasn't obvious that the fund was set to break out of the trading range that’s persisted since mid-April.
Solid gains for the portfolio strategy benchmarks
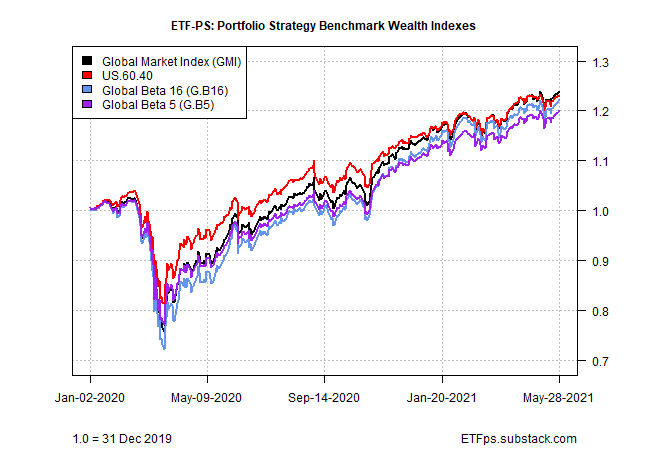
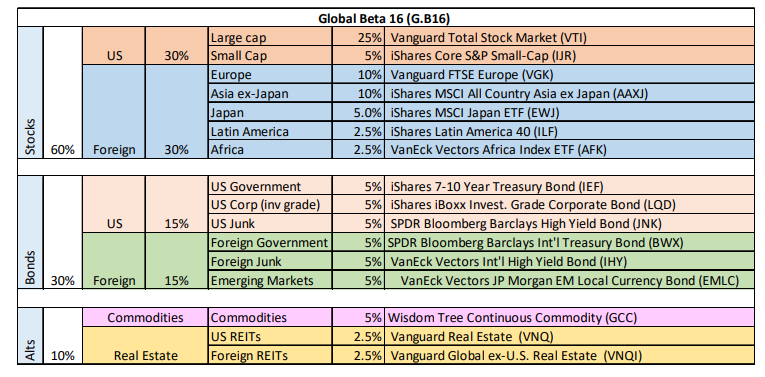
The leader was Global Beta 16 (G.B16), which holds all the ETFs in the table above, rebalanced at year-end to the weights shown below. G.B16’s 1.5% increase last week keeps it comfortably in the lead for year-to-date results too.
The weakest strategy benchmark performer last week: US 60/40 equity/bond mix (US.60.40). Although a 1.0% gain is certainly respectable, the US-focused benchmark remained the laggard (still) for 2021 results, further strengthening the suspicion that globally diversified strategies are in the early stages of making a comeback.

