US REITs rise for a fourth week
Shares of US real estate investment trusts (REITs) can do no wrong these days. After a relatively sluggish rebound from the coronavirus crisis last year, securitized real estate is making up for lost time.
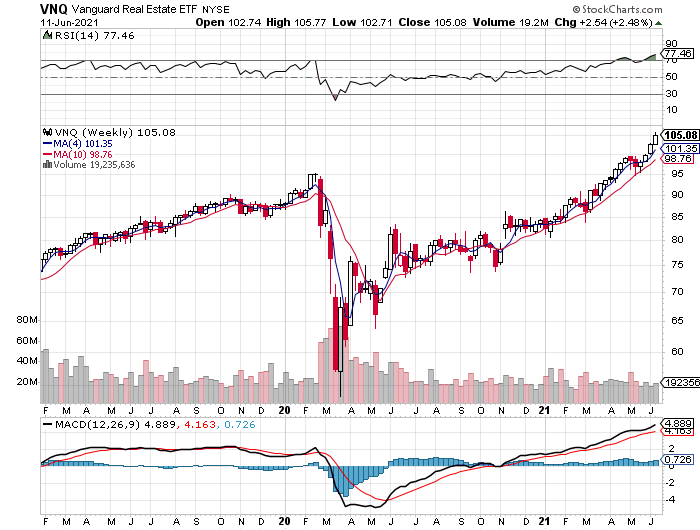
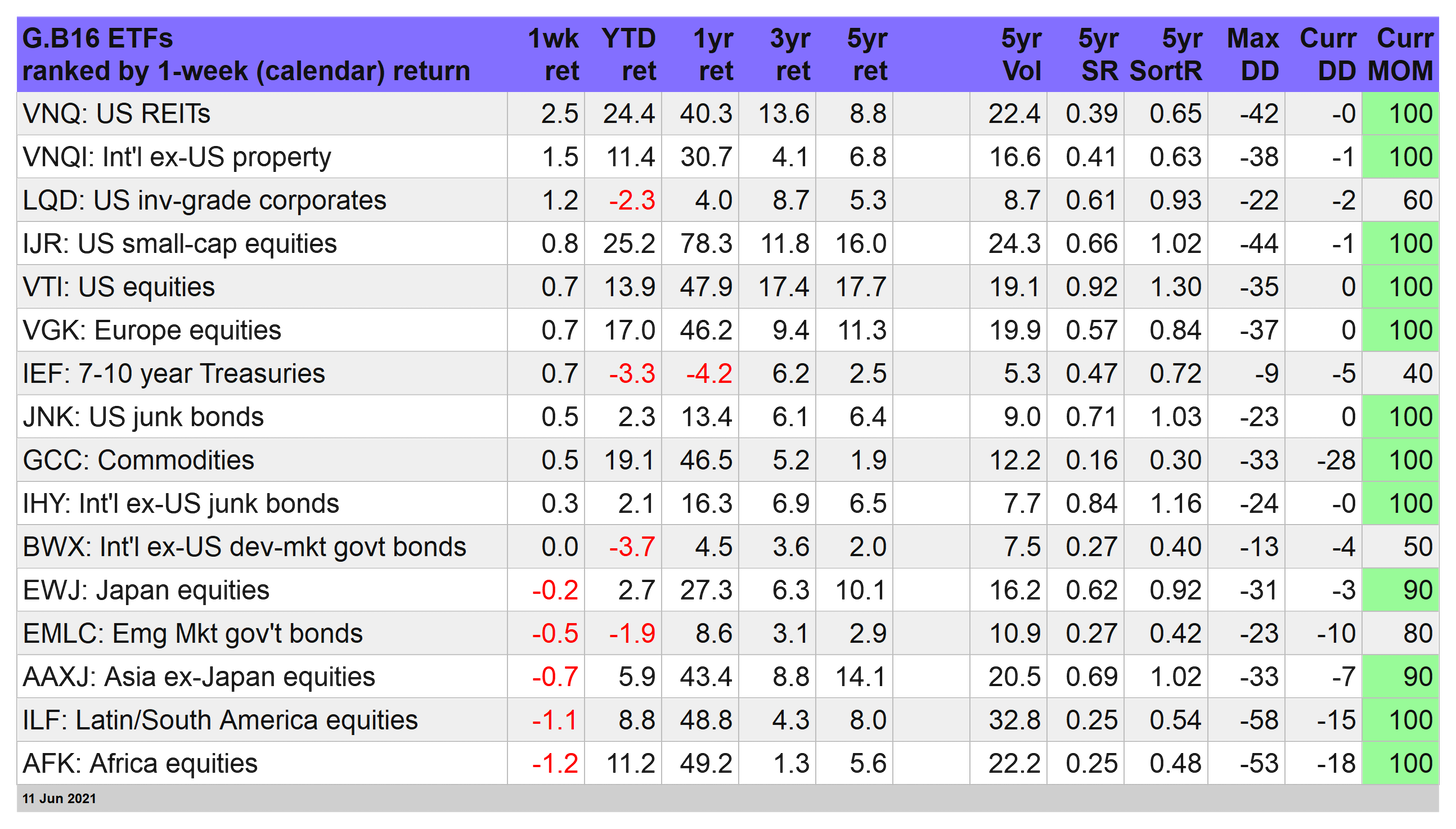
Vanguard Real Estate Index Fund ETF Shares (NYSE:VNQ) topped last week’s performances for our global opportunity set (see table below), based on trading through Friday’s (June 11). VNQ rose 2.5% for the week, building on the previous week’s 2.7% rally. The fund hasn’t had a down week since mid-May.
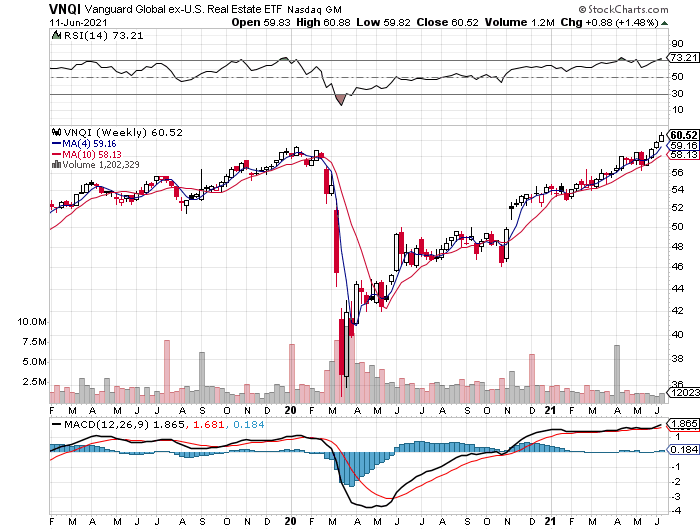
Foreign property shares continue to rally too. Vanguard Global ex-U.S. Real Estate Index Fund ETF Shares (NASDAQ:VNQI) rose 1.5% last week, second only to VNQ.
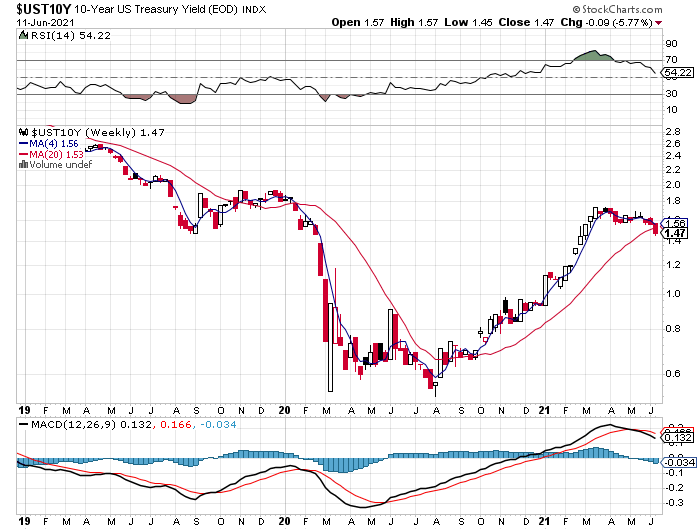
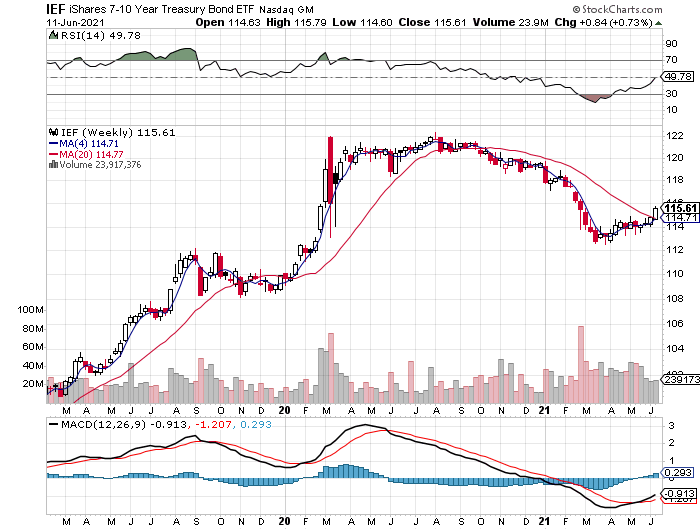
Supporting the yield-oriented market for securitized real estate: another week of falling interest rates. The 10-year Treasury yield declined for a fourth straight week, slipping to 1.47%—close to a three-month low. Notably, the 10-year rate fell below it’s 20-week average for the first time in nearly a year. The implication: flat-to-lower rates remain the baseline outlook.
Lower yields, of course, equate with higher bond prices and iShares 7-10 Year Treasury Bond (NYSE:IEF) rallied 0.7%. The bearish trend in the first quarter for IEF has reversed course, at least relative to recent history. The fund ended the week near its highest level since late-February.
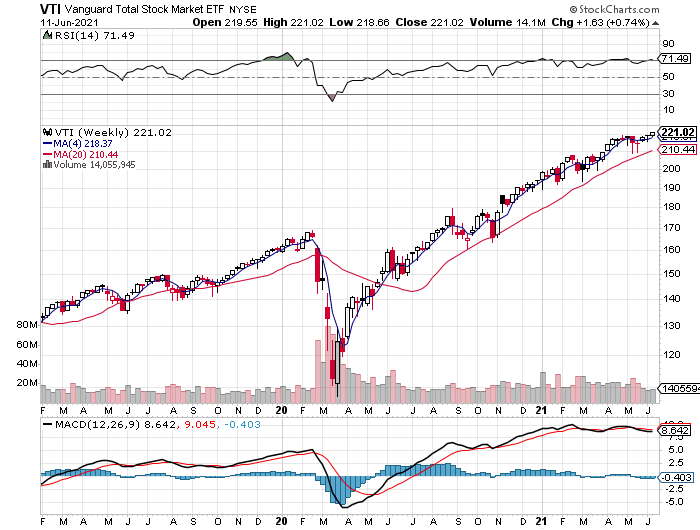
US stocks rose, too, although results are middling this week relative to markets around the world. Nonetheless, Vanguard Total Stock Market Index Fund ETF Shares (NYSE:VTI) added 0.7%, closing at a record high.
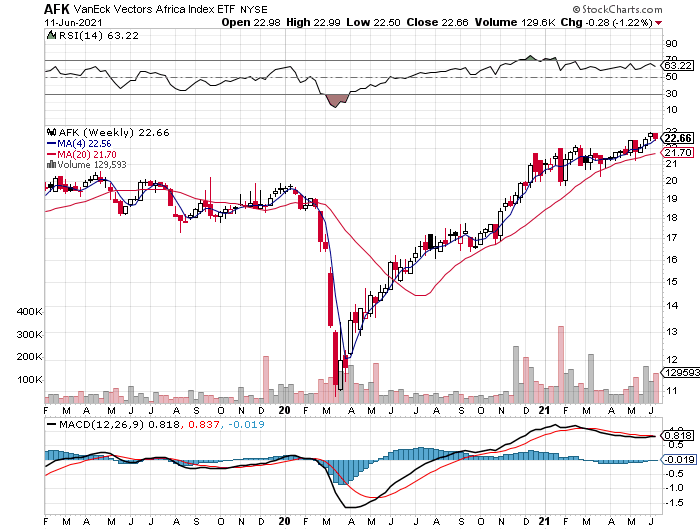
There were several losers on our radar for asset classes last week, primarily in Asia. The biggest setback: stocks in Africa VanEck Vectors Africa Index ETF (NYSE:AFK), which fell for the first time in four week with a 1.2% slide.
Strategy benchmarks continue to rise
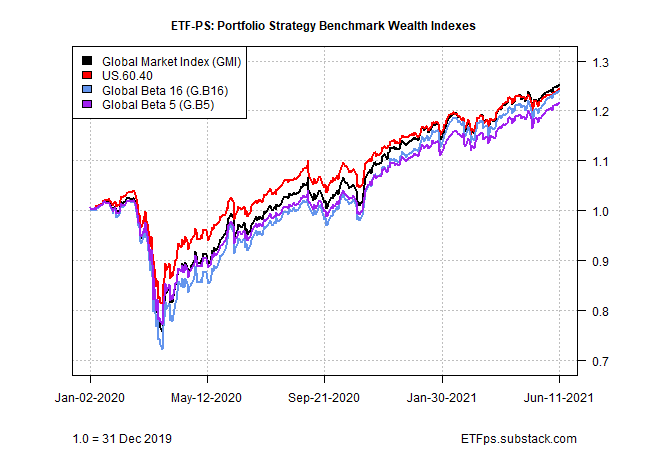
It was another good week for our portfolio benchmarks. After several weeks of trailing globally diversified strategies, the US 60/40 Index (US.60.40) topped the charts, rising 0.7%. Year-to-date, the US strategy gauge is still trailing with a relatively modest 7.6%, but with US rates flat to lower, perhaps there’s a revival brewing. For details on all the strategy rules and risk metrics, see this summary.
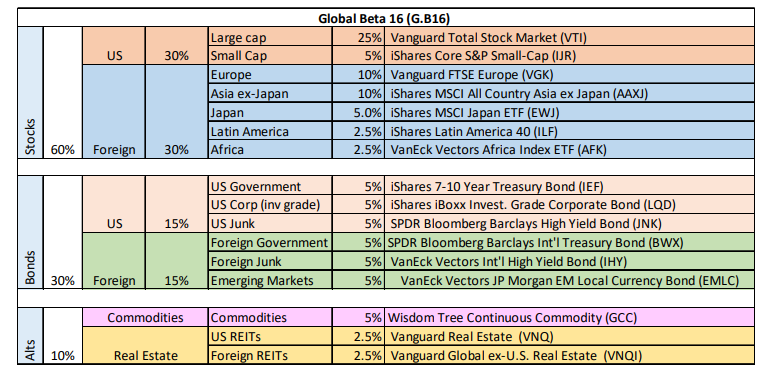
Leading the way so far in 2021: Global Beta 16 (G.B16), which remains comfortably on top with a strong 10.3% year-to-date return.
There are several potential demons lurking, including the possibility that hotter-than-expected inflation will spoil the party. US consumer prices continue to surprise on the upside, as the CPI report for May shows. But markets shrugged off the news, preferring instead to side with the Federal Reserve and assume that higher inflation of late is a temporary affair.
As BNY Mellon Investment Management’s chief strategist, Alicia Levine advised, the Fed’s willingness to keep rates lower for longer is a “great recipe for risk assets.”
Analysts are fiercely debating if policymakers are making a strategic error—or looking through noise. Markets, however, remain convinced that nothing much has changed and it’s still timely to favor risk-on.

