Winning Behavior
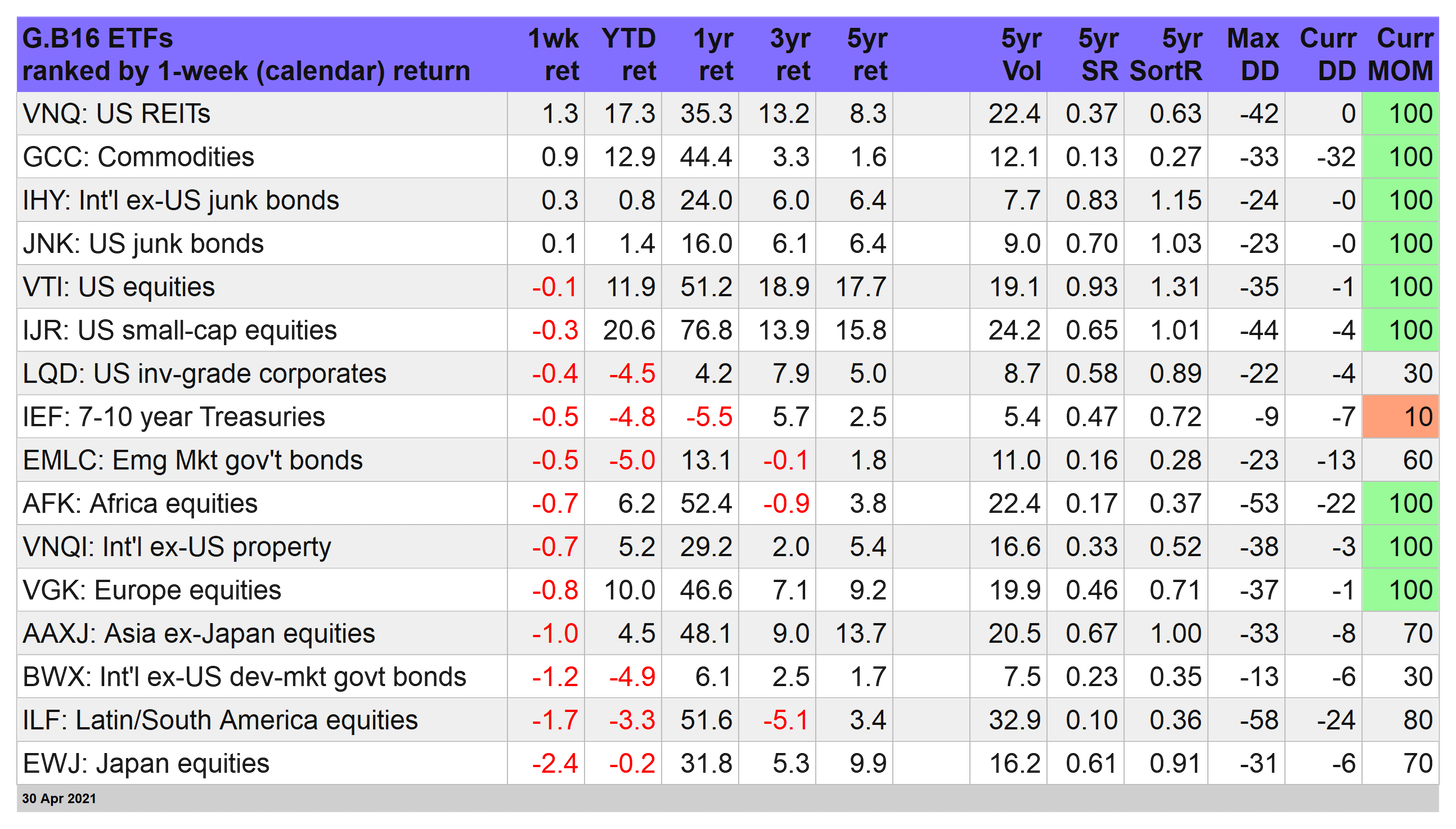
The winners keep winning and the losers, well, it’s a bit complicated for last week’s losers. But for the top-performers last week for our broad set of ETF proxies for global asset classes, the winning streaks roll forward.
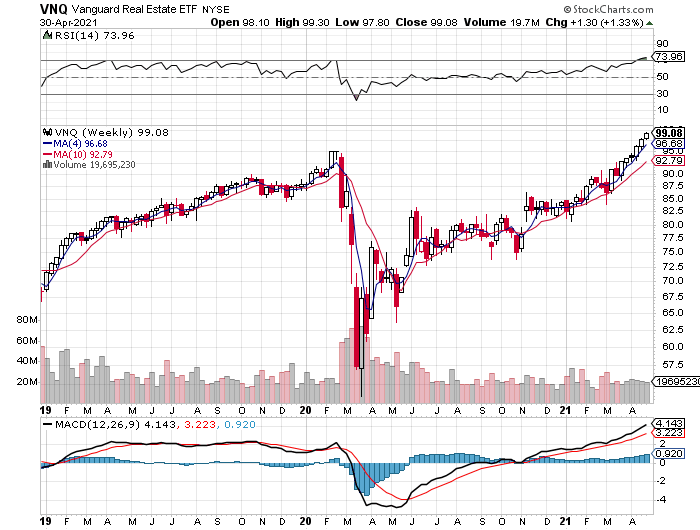
Vanguard Real Estate Index Fund ETF Shares (NYSE:VNQ) jumped 1.3% for the trading week through Friday's close (Apr. 30). For those of you counting, that’s six straight weekly gains as the fund, which holds American real estate investment trusts (REITs), continues to forge new record highs.
What’s lighting a fire under US REITs? Several possibilities are in the air, including the latest addition to the list: REITs are expected to remain immune to the proposed corporate taxes rolled out by the Biden administration.
Since REITs are so-called pass-through entities from a tax perspective, corporate taxes won’t apply. As such, REITs and their relatively high payout ratios are all the more attractive. The market certainly seems to agree.
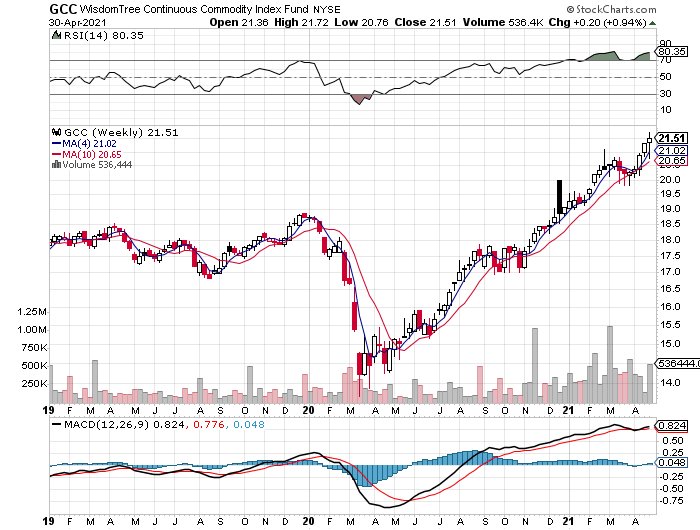
Commodities were the second-best performer this week. WisdomTree Continuous Commodity Index Fund (NYSE:GCC) rose 0.9%, marking the fifth consecutive weekly advance.
The animating drivers: economic recovery and expectations that inflation is heating up. Friday's first look at the Q1 GDP data revealed a red-hot economy that increased 6.4%. Ignoring 2020’s extraordinary one-time bounce in Q3 following the initial pandemic shock, the Q1 rise is the best quarter for growth in 18 years for the US economy.
Combine that with a growing chorus of forecasts that inflation is headed higher, at least for the short term, and commodities are enjoying something of a macro nirvana party. It’s debatable if inflation’s rise is temporary or the start of a longer run of hotter pricing pressure. But for commodities bulls, it’s all about buy now and ask questions later.
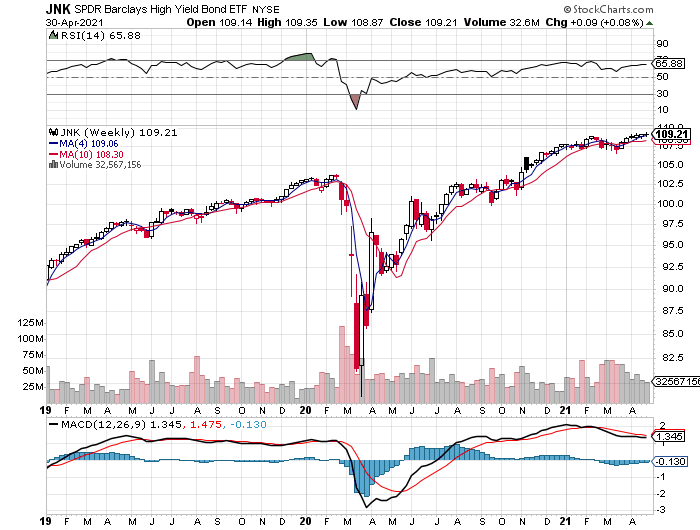
US junk bonds continued to rise, too. SPDR® Barclays US High Yield Bond ETF (NYSE:JNK) has rallied for six straight weeks. The rally appears to be wearing thin, however. Maybe that’s because interest rates are showing signs of rising again after a brief hiatus and the yield premium on junk is close to a 14-year low.
Note, too, that the benchmark 10-year Treasury yield posted its first weekly rise this month, edging up to 1.65%.
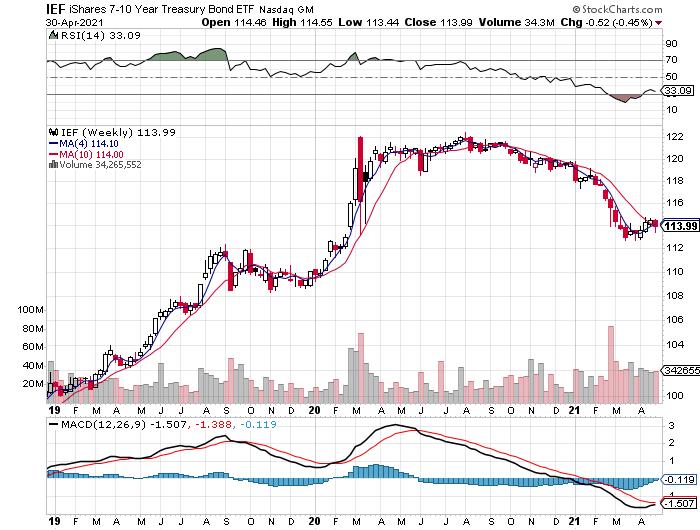
Not surprisingly, bonds (at least in the investment-grade bucket) lost ground last week. The iShares 7-10 Year Treasury Bond ETF (NYSE:IEF) fell 0.5%, fueling new concern that the respite from a long string of weekly losses is ending.
Meantime, US stocks had the mildest of setbacks last week—Vanguard Total Stock Market Index Fund ETF Shares (NYSE:VTI) slipped fractionally, marking the first weekly loss (just barely) since mid-March.
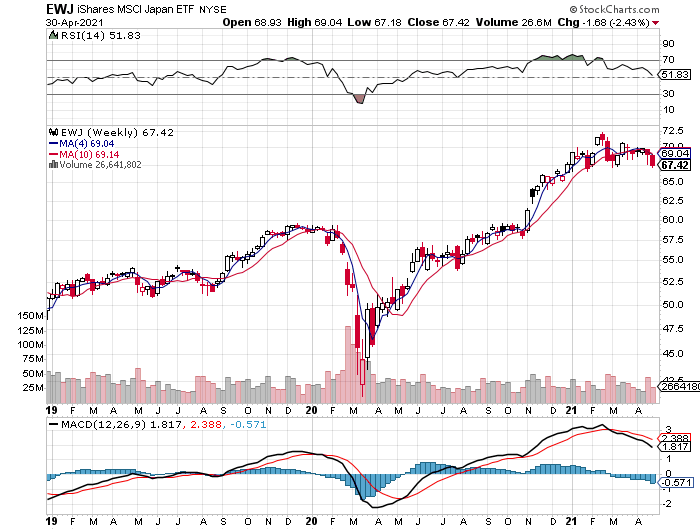
The big loser on our list of global proxies last week: stocks in Japan via iShares MSCI Japan ETF (NYSE:EWJ), which gave up a hefty 2.4%. The loss left the fund essentially at the lower bound of the trading range for the year-to-date.
If EWJ trades lower this week, technically speaking, the setback would look relatively dark for the ETF’s near-term outlook. Another week of selling looks plausible, even likely if you consider that the bearish mood is partly linked to a new wave of pandemic blowback in Japan’s big cities.
The End Of A 5-week Winning Streak
It had to happen eventually and last week was as good a week as any.
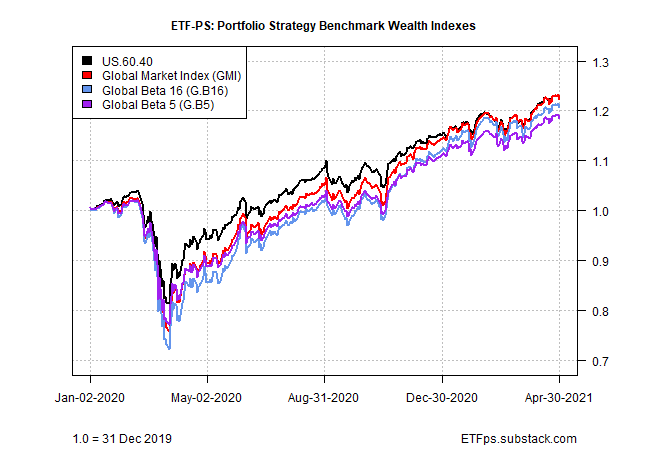
After more than a month of weekly gains, the red-ink brigade finally caught up with our strategy benchmarks and all four lost ground last week.
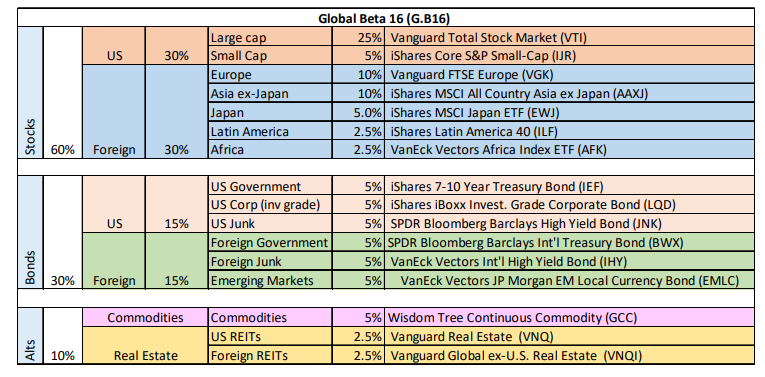
The biggest decline: Global Beta 16 (G.B16), which shed 0.6%. Despite the loss for this 16-fund opportunity set (per the funds in the table above), G.B16 continues to hold the lead for year-to-date results, rising 7.3% for the year so far through Friday's close. For details on all the strategy rules and risk metrics, see this summary.
Is this the start of an extended correction? No one should rule out the possibility after widespread gains for most markets for much of the past year. But the strong upside momentum in all four benchmarks (per the MOM score in the table above) suggests otherwise.
Granted, there are still plenty of things that could go wrong, starting with a global pandemic that’s still not under control. But if recent trending behavior is a guide, there’s still more upside left for multi-asset-class strategies.

