Starting with the next update of our proprietary strategies, Global Momentum (G.B16.MOM) will join the party. In-line with the other two prop strategies, G.B16.MOM will use our standard 16-ETF opportunity set that spans the major asset classes on a global basis.
The difference: G.B16.MOM will use price momentum as a risk-management tool (vs. return volatility and drawdown for the other two strategies).
The rule governing G.B16.MOM’s management is simple by design: at the end of each calendar month, each fund is evaluated for risk-on or risk-off. If the month-end price is above the 10-month average (based on month-end prices), the ETF is held (or purchased if previously risk-off).
Risk-off signals are defined as month-end prices at or below the 10-month average.
Any trades are assumed to take place at the open on the next trading day. For positions in risk-off, a cash proxy ETF is held—iShares Short Treasury Bond ETF (NASDAQ:SHV).
So, for instance, the allocation to US stocks will toggle back and forth between the Vanguard Total Stock Market Index Fund ETF Shares (NYSE:VTI) and SHV.
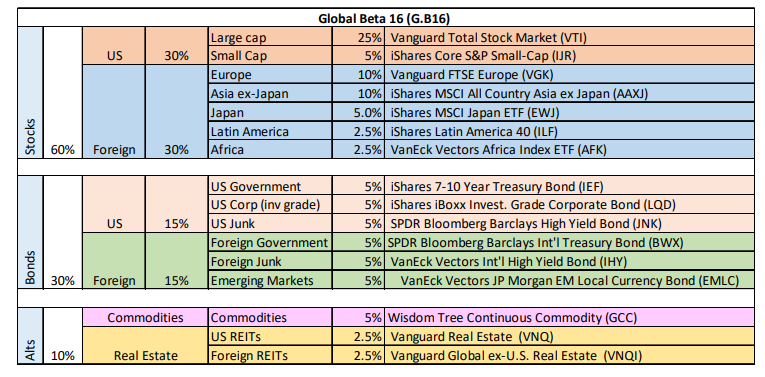
At the end of each calendar year, all the fund allocations (regardless of the prevailing risk signal) are rebalanced to the benchmark’s weights via Global Beta 16 (G.B16), which is broadly allocated as a global allocation of stocks (60%), bonds (30%) and alternatives (10%) via commodities and real estate.

The year-end rebal weights (per the table above) are common across all three prop strategies and for the G.B16 benchmark as well. Ditto for the ETF opportunity set. The only differences: trading rules.
G.B16.MOM differs in that the trading frequency is monthly (potentially, depending on the signals). That’s in contrast with the weekly frequency for the other two strategies and the annual frequency for G.B16’s rebal.
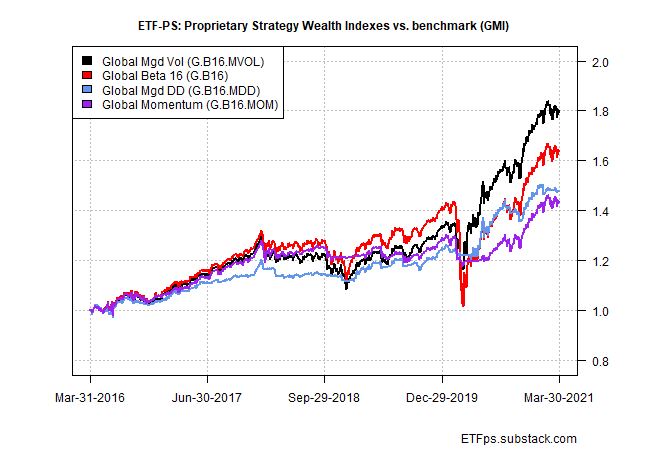
One possible advantage of G.B16.MOM relative to the other two prop strategies: lower turnover, perhaps significantly so. For comparison in terms of risk and return, here’s how the G.B16.MOM stacks up against its two competitors and the G.B16 benchmark over the past five years (through Mar. 30).


Relative to the benchmark, G.B16.MOM’s performance has been roughly one-quarter lower. Note, however, that the softer return has been linked with an even deeper reduction in risk.
Annualized return volatility, for instance, is nearly half as low as G.B16 and the maximum drawdown was two-thirds lower. As a result, G.B16.MOM’s Sharpe ratio is notably higher than the benchmark’s—0.98 vs. 0.74, which indicates a higher risk-adjusted return.
As for risk allocation, G.B16.MOM’s current profile (based on signals at February’s close) is a mostly risk-on bias. That is, just three of the 16 fund holdings are risk-off.

For details on all the strategy rules and risk metrics, see this summary.
