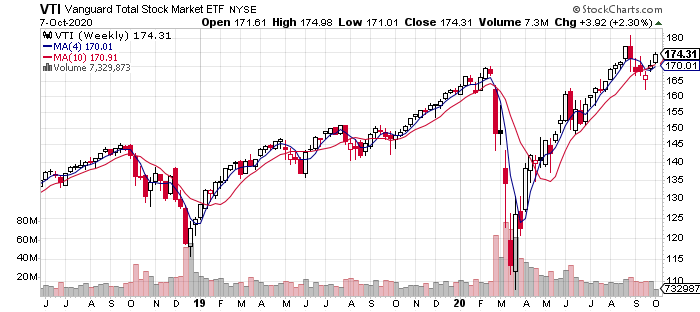
Election/political risk in various forms has been squeezing the US equity market in recent weeks, but the correction appears, once again, to be a temporary diversion.
Vanguard Total Stock Market Index Fund (NYSE:VTI) is on track to post a second weekly gain after today’s rally (through Oct. 7), or so one could imagine. VTI is up 2.3% for the week to date, ending the session at the highest close since Sep. 2, when the ETF rose to a record high.
Is a new record high in sight? It’s getting easier to imagine a fresh peak on the near-term horizon. Despite increasing anxiety over a contentious US election next month, along with the usual Covid-19 complications for the economy, the crowd is focused on the positives, including revived hopes of fiscal stimulus from Congress (only a day after President Trump appeared to scotch the idea in a late-afternoon tweet on Tuesday).

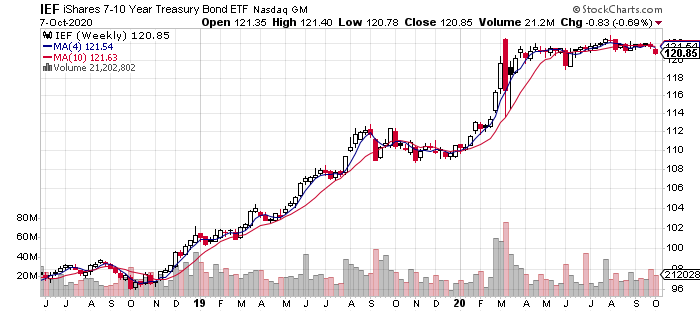
Bonds, on the other hand, continue to slide. The iShares 7-10 Year Treasury Bond (NYSE:IEF) is down 0.7% so far this week, closing at the price since June 16.
One line of thinking is that as polls continue to show Joe Biden leading Donald Trump, along with a reasonable possibility of a Democratic sweep of both houses of Congress, the probability is rising for an aggressive stimulus program next year, along with greater amounts of deficit spending. If so, the “smart” money is now betting that inflation will pick up and take a bite out of bonds. Ergo, sell the safe havens.

Regular readers of The ETF Portfolio Strategist know that risk-off for IEF (and its US corporate counterpart LQD) has been in play weeks in Global Managed Drawdown strategy (G.B16.MDD). Given today’s price action, that call still looks like it has room to run.
Holding On To Strong Year-to-Date Returns: This year has been one for the history books, but apparently short-term volatility is no obstacle to solid results, at least for certain flavors of risk-managed strategies.
As of today’s close, G.B16.MDD continues to post a double-digit return for 2020 (+12.3%), despite an expanding risk-off posture in the portfolio in recent history.
Global Managed Volatility (G.B16.MVOL) is doing even better with an 18.0% year-to-date rise. The higher performance is related to the ongoing risk-on profile for all holdings in the strategy. The question is whether the fading prices in bond funds will change the calculus? Tune in on Friday for an update for the usual end-of-week rebalancing review.
Meantime, Global Minimum Volatility (G.B16.MINV) is still having a rough ride this year, posting a relatively weak 0.9% year-to-date gain. Then again, it’s delivering on its low-vol profile, but in 2020 that’s come at a heavy price in relative performance terms.

For perspective, the portfolio-strategy benchmarks are up between 1.5% and 7.4% this year. Global Beta 16 (G.B16) is still the weakest of the bunch in 2020. Keep in mind that this strategy holds the same set of 16 funds as the three risk-managed strategies above and uses the same year-end rebalancing target weights. The only difference: G.B16 lets Mr. Market run the show, no questions asked.

Here’s how four BlackRock (NYSE:BLK) asset allocation funds stack up:

