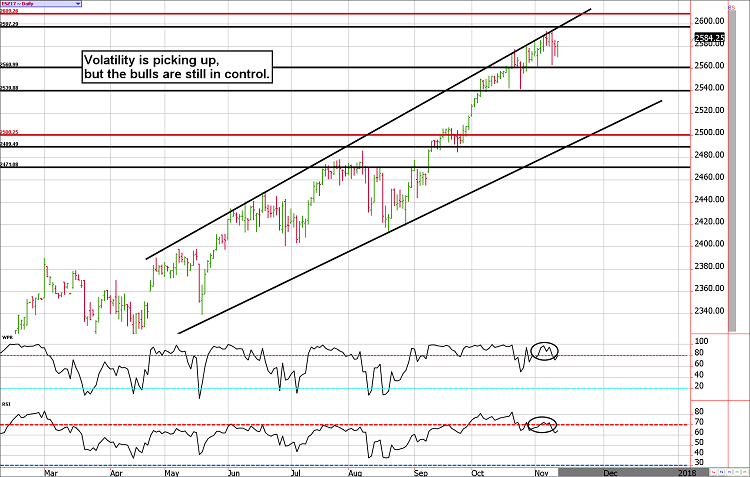
The E-mini S&P 500 traded lower two days in a row for the first time since late September.
Although losses were minimal, the ES managed to settle in the red on two consecutive trading sessions to close out last week. In a normal market this wouldn't be worth a mention, but in this market, it is a rare occurrence. The last consecutive negative closes took place on September 25th and 26th. Before that, you have to scroll the chart back to early August!
I doubt the bulls are concerned in light of the fact that the ES is within 15 points of its all-time-highs. On the flip side, the bears must be growing concerned over the fact that the seasonal tendencies from Thanksgiving through the end of the year generally call for higher stock prices.
That said E-mini S&P futures traders are holding one of the longest positions we've seen this year. Thus, one has to wonder if the bulls will soon run out of capital. After all, most of the bears have already been squeezed out of positions. This is true even in the stock market, the percentage of outstanding short positions on individual equity products is near record lows.
Treasury Futures Market
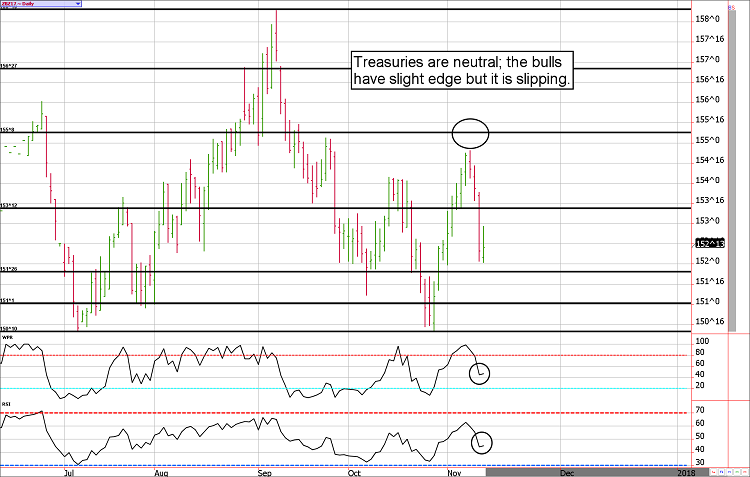
Tax reform probably won't live up to the hype and seasonals are a "buy" for Treasuries.
As a short-term Treasury bull, we were disappointed by the sluggish trade that closed out last week. However, we also know that Friday's in Treasuries are often counter-trend and aren't necessarily telling as to what the future might bring. Monday's stability suggests the bulls still hold a slight edge.
Further, our friends at MRCI have pointed out a seasonal trade in the December 30-year bond that suggests buying on, or near, November 13th and holding through the 26th has produced profits in 12 of the last 15 years.
We are holding a neutral-to-bullish position in the 10-year note in anticipation of the seasonal boost (notes should follow bonds higher if it happens), but will be looking for a place to lock in profits in the coming week or two (assuming things go as planned).Treasury
Futures Market Analysis
**Bond Futures Market Consensus:** A seasonal buy is looming but bulls lack conviction. We are leaning moderately higher.
**Technical Support:** ZB : 151'26, 151'0, 150'10 and 149'07 ZN: 124'13, and 124'03.
**Technical Resistance:** ZB: 153'12, 155'8, 156'27, and 157'19 and 158'11 ZN: 125'12, 125'24, 126'15, 127'08 and 127'25
Stock Index Futures Market
The stock market bears had better act quickly
According to seasonal tendencies, the closer we get to the holiday season the more bullish the stock market tends to get. Maybe it is Christmas spirit, but we think it has more to do with low volume short squeezing than anything. That said, this year might be interesting; most of the shorts are already squeezed out...is their anyone else left to squeeze? On the other hand, there doesn't seem to be any shortage of retail investors putting money to work in stocks. Perhaps, these are the same investors who were scrambling to cash out of the equity market in early 2009. We will soon find out.
MRCI suggests a seasonal "buy" signal occurs from November 19th through December 6th. This trade has worked 100% of the time over the last 15 years.
Stock Index Futures Market Ideas
**E-mini S&P Futures Market Consensus:**
The ES has surpassed our expectations, but that doesn't change the big picture. It is a better "sell" than it is a "buy" from these levels.
**Technical Support:** 2560, 2539, 2499, 2478, and 2438
**Technical Resistance:** 2599, and 2608
E-mini S&P Futures Day Trading Ideas
**These are counter-trend entry ideas, the more distant the level the more reliable but the less likely to get filled**
ES Day Trade Sell Levels: 2587, 2597, and 2608
ES Day Trade Buy Levels: 2564, 2556, 2548, and 2539
In other commodity futures and options markets....
July 28 - Buy December Copper $2.50 puts for about $200.
August 9 - Buy December wheat $5.50 calls for about 5 cents.
September 8 - Buy December crude oil $41 puts near 22 cents ($220).
September 15 - Sell December ES future near 2493 and then sell a December 2500 put against it. The net credit is about 45.00.
October 3 - Covered calls in the 10-Year note; go long the March ZN future near 125'0 and sell a 125'0 call against it for about 1'0.
October 4 - Adjust the bearish ES trade by buying back the December 2500 put and then selling the January 2500 put. This adds about 20 points to the profit potential and offers a better risk buffer on the upside.
October 12 - Buy March wheat near $4.50 and sell a $4.50 call option against it.
October 20 - Buy back the January ES 2500 put to lock in a gain and the sell a March ES 2500 put for a 20 point credit to create a better risk buffer for our short ES position.
October 24 - Buy back January 125 ZN call to lock in a gain. Then sell the March 125 call to bring in additional premium to cushion the downside risk to our long ZN position.
November 1 - Sell February live cattle 138 call option for about 1.25 in premium ($500).
November 1 - Bull call spread with a naked leg in May corn (buy the May 3.70 call, sell the 4.00 call and the 3.50 put). The cost of the trade is 3 to 4 cents, the risk is open under 3.50, the profit potential is roughly 26 cents or $1,300.
November 6 - Sell February crude oil $63 call near 52 cents.
November 10 - Take a quick profit on the Feb live cattle call option. Most were profitable by about 60 to 65 ticks before transactions costs per lot ($240/$260).
**There is substantial risk of loss in trading futures and options.** These recommendations are a solicitation for entering into derivatives transactions. All known news and events have already been factored into the price of the underlying derivatives discussed. From time to time persons affiliated with Zaner, or its associated companies, may have positions in recommended and other derivatives. Past performance is not indicative of future results. The information and data in this report were obtained from sources considered reliable. Their accuracy or completeness is not guaranteed. Any decision to purchase or sell as a result of the opinions expressed in this report will be the full responsibility of the person authorizing such transaction. Seasonal tendencies are a composite of some of the more consistent commodity futures seasonals that have occurred over the past 15 or more years. There are usually underlying, fundamental circumstances that occur annually that tend to cause the futures markets to react in a similar directional manner during a certain calendar year. While seasonal trends may potentially impact supply and demand in certain commodities, seasonal aspects of supply and demand have been factored into futures & options market pricing. Even if a seasonal tendency occurs in the future, it may not result in a profitable transaction as fees and the timing of the entry and liquidation may impact on the results. No representation is being made that any account has in the past, or will in the future, achieve profits using these recommendations. No representation is being made that price patterns will recur in the future.
