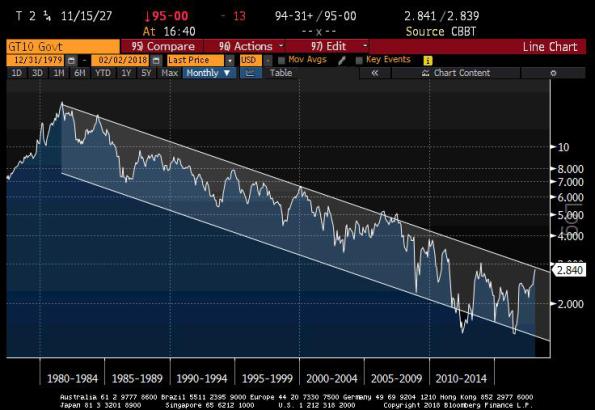
It’s hard to believe that 10-year yields in the US have doubled in the last 18 months. It’s the last 50bps, taking us from 2.35% to 2.84% since December, that has received the most attention but 10-Y Treasury rates have literally spanned the width of the nearly 40-year-old channel over that 18 months (see chart, source Bloomberg).

Such a long-term chart needs to be done in log scale, of course, because a 200bp move is more significant when rates are at 2% than when they are at 10%. I have been following this channel for literally my entire working career (more than a quarter-century now), and only once has it seriously threatened the top of that channel. Actually, that was in 2006-07, which helped precipitate the last bear market in stocks. Before that, the last serious test was at the end of 1999, which helped precipitate that bear market.
You get the idea.
The crazy technicians will note that a break above about 3.03%, in addition to penetrating this channel, would also validate a double bottom from the last five years or so. Conveniently, both patterns would project 10-year rates to, um, about 6%. But don’t worry, that would take years.
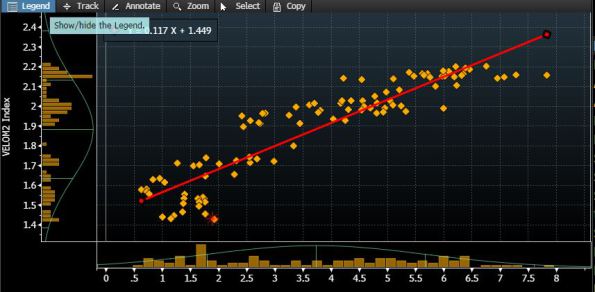
Let’s suppose it takes 10 years. And let’s suppose that velocity does what it does and follows interest rates higher. The regression below (source: Bloomberg) shows my favorite: velocity as a function of 5-Y Treasury rates. Rates around 5% or 6% would give you an eyeball M2 velocity of 2.1.

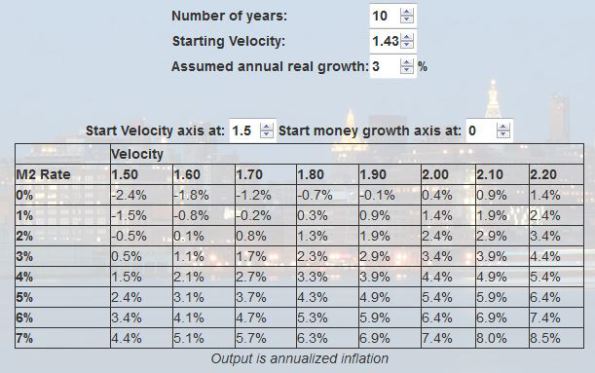
So, let’s go to the calculator on our website, and see what happens if money velocity goes to 2.1 over the next decade, but real growth averages a sparkling 3%.

Looking down the “2.1” column for velocity, we can see that if we want to get roughly 2% inflation – approximately what the market is assuming – then we need to have money growth of only 1% per annum for a decade. That is, the money supply needs to basically stop growing now.
The only problem with that is that there are trillions in excess reserves in the banking system in the US, and trillions upon trillions more on the balance sheets of other central banks, and not only does the Fed not plan to remove all of those reserves but rather to maintain a permanently larger balance sheet, but other central banks are still pumping reserves in. So, you can see the problem.
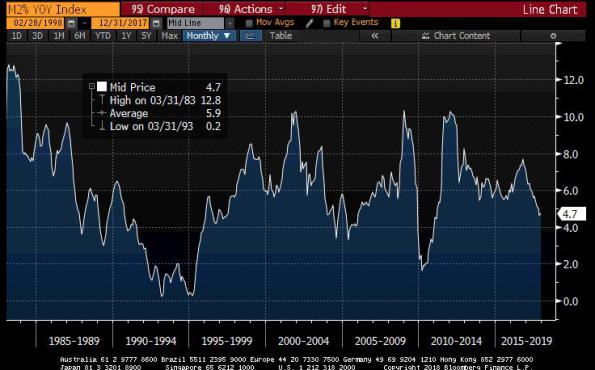
If money growth is only 3%, then you’re looking at average inflation over the next decade of 3.9% per annum. By the way, average money growth in the US since the early 1980s has been 5.9% (see chart, source Bloomberg). Moreover, it has been below 3% only during the recessions of the early 1990s and the global financial crisis, and never for more than a couple of years at a time.

The bottom line is that rising interest rates and more importantly rising money velocity create a very unfortunate backdrop for inflation, and this is what creates the trending nature of inflation and the concomitant ‘long tails’: higher rates create higher velocity, which creates higher inflation, which cause higher rates. Etc.
The converse has been true for nearly 40 years – a happy 40 years for monetary policymakers. Yes, I know, there are a lot of “ifs” above.
But notice what I am not saying. I am not saying that interest rates are going directly from 3% to 6%. Indeed, the rates/equity ecosystem is inherently self-dampening to some degree (at least, until we reach a level where we’ve exceeded the range of the spring’s elasticity!) in that if equity prices were to head very much lower, interest rates would respond under a belief that central bankers would moderate their tightening paths in the face of weak equities. And if interest rates were to head much higher, we would get such a response in equities that would provoke soothing tones from central bankers. So tactically, I wouldn’t expect yields to go a lot higher from here in a straight shot.
I am also not saying that money velocity is going to gap higher, and I am not saying that inflation is about to spring to 4% (in fact, just the other day I said that it will likely be mainly the optics on inflation that are bad this year because some one-off events are rolling out of the data). Just as with interest rates, this cycle will take a long time to unwind even if, as I suspect, we have finally started that unwind.
We’re going to have good months and bad months in the bond market. But the general direction will be to yields that are somewhat higher in each subsequent selloff. And some Bizarro Bill Gross will be the new Bond King by riding yields higher rather than riding them lower.
I am also told that mortgage convexity risk, which in the past has taken rallies and selloffs in fixed-income and made them more extreme, is less of a problem than it used to be, since the Fed holds most mortgages and servicing rights have been sold from entities that would hedge extensions to those who “just want yield” (unclear how this latter group responds to the same yield, at longer maturities). On the other hand, the Volcker Rule has gutted a lot of the liquidity provision function on Wall Street, so if you have a million to sell you’re okay; if you have a yard (a billion) then best of luck.
I will note that real yields are still lower (10-year TIPS yields 0.70%) than they reached at the highs in 2016, which were lower than they got to in 2015, which were lower than they hit in 2013. The increase in interest rates is not coming from a surge in belief about rising real growth. The increase is coming from a surge in concern about the backdrop for inflation. For nominal interest rates to go much higher, real yields will have to start contributing more to the selloff. So I think we are probably closer to the end of the bond selloff, than to the beginning…at least, this leg of it.
