June was hot for the central banks. The Federal Reserve lifted the federal funds rate for the second time this year, while the European Central Bank announced that it would end its bond purchase program by the end of 2018. It would mean another step towards normalization of the crisis-era monetary policy, which would end quantitative easing on both sides of the Atlantic Ocean. What do these important developments imply for the gold market?
On June the 13th, the Fed raised interest rates for another 25 basis points. It was the second hike in 2018 and the seventh in this tightening cycle. The move was widely expected, so it did not shake the markets. However, the Fed’s statement was more hawkish than anticipated, as the U.S. central bank suggested two more rate hikes this year.
The next day, on June the 14th, the ECB released its timid monetary policy statement, followed by Draghi’s press conference, which contrasted with the Fed’s decisively hawkish stance. It was interpreted as dovish, because it stated that the quantitative easing program would end only at the end of the year. Moreover, the ECB promised that there will be no hikes in interest rates at least through to the summer of 2019. Thus, Draghi announced the end of the asset purchase program, but with a dovish flavor.
Indeed, the Governing Council downgraded its Eurozone growth forecast from 2.4 percent previously to 2.1 percent, emphasizing the rising risks to the outlook. “This decision has been taken in the presence of a strong economy with increasing uncertainty”, said Draghi.
However, somewhat counterintuitively, gold gained in the immediate response to the Fed’s hawkish announcement and the ECB’s dovish meeting. In a sense, it shouldn’t be surprising at all, as “sell the rumor, buy the fact” used to be dominant strategy during this tightening cycle: the yellow metal weakened prior to the Fed’s meetings, but rallied afterwards.
But the fact that gold prices were able to rise for a while amid the surge in the greenback is significant and requires a more detailed examination. We offer two points about this unusual development. First, the ECB’s stance is actually not as dovish as some analysts interpret it. Why? Remember the Fed’s tapering? The U.S. central bank announced it in December 2013, not providing any specific ending. In contrast, the ECB put a specific end-date on its stimulus, which could be considered a more decisive step compared to Fed. Moreover, Draghi downplayed the turmoil in Italy, although some analysts forecasted that turbulence on the Apennine Peninsula could force the ECB to adopt a more cautious approach. But it didn’t happen. Draghi said that “contagion was not significant, if any, if at all, so it was a pretty local episode and so we haven’t seen the redenomination risk.”
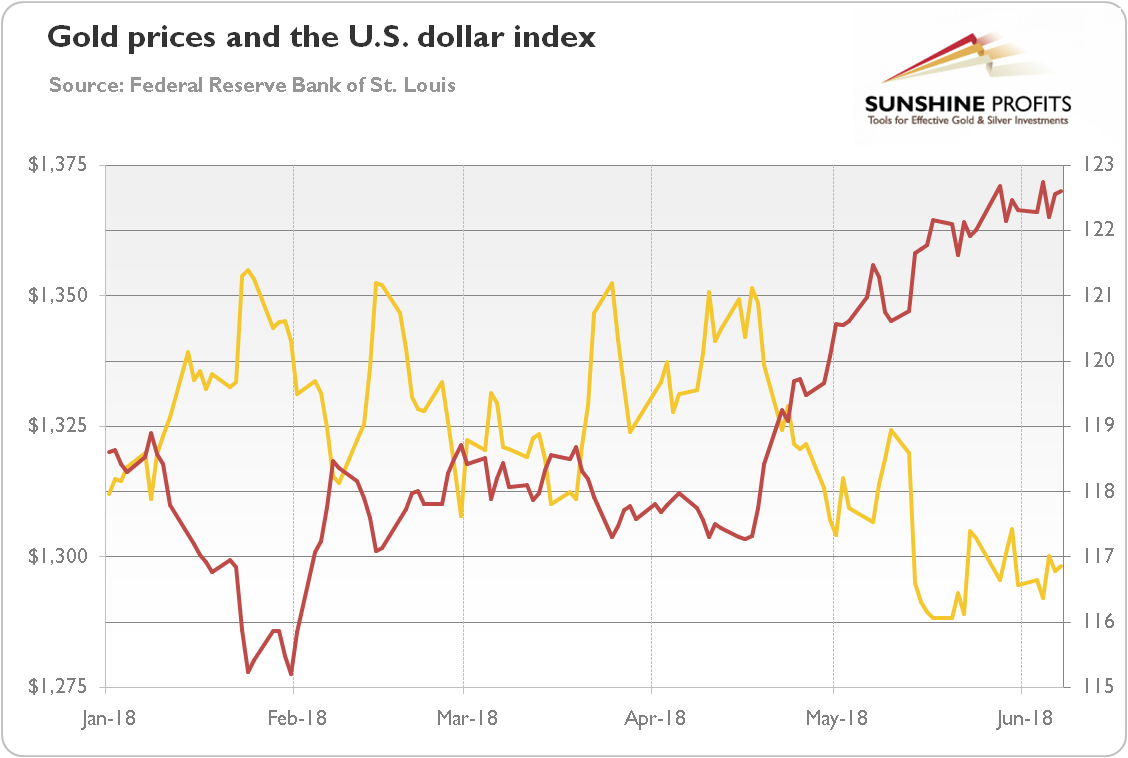
Second, it might be the case that the well-established negative correlation between the greenback and the shiny metal has somewhat weakened, allowing gold to stay afloat or even climb amid strengthening dollar. Let’s look at the chart below, which paints the gold prices and the broad dollar index. As one can see, the dynamic of one asset looked like the mirror image of the other until May – but then something happened and the correlation has weakened since.
Chart 1: Gold prices (yellow line, left axis, London P.M. Fix, in $) and U.S. dollar index (red line, right axis, broad trade weighted index).

What has happened? Well, as we explained in the November 2014 edition of the Market Overview, greenback and gold sometimes move in tandem and it’s nothing special. It usually happens when investors fear about the future of the Eurozone and the euro.
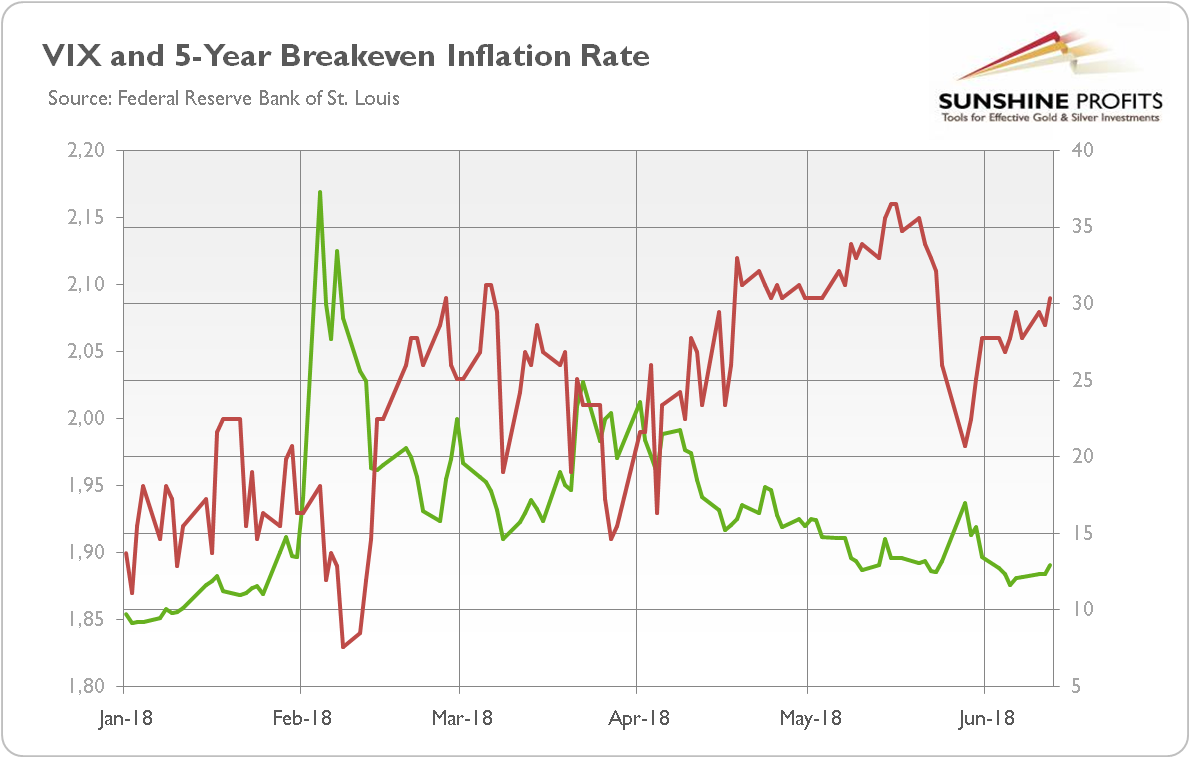
However, there is another possible explanation: with the Fed’s hike behind it, gold investors look now at heightened market volatility and rising inflation explanations (see the chart below, which paints the CBOE VIX index and the measure of a measure of expected inflation derived from 5-Year Treasury Constant Maturity Securities and 5-Year Treasury Inflation-Indexed Constant Maturity Securities). Both of them have been rising in June.
Chart 2: CBOE VIX (green line, right axis) and 5-Year Breakeven Inflation Rate (red line, left axis, in %) in 2018.

Another issue is that gold investors are forward-looking. The Fed has just hiked interest rates seventh time since December 2015. So it is quite deep into a tightening cycle, with rather limited room for U.S. rates to move substantially higher relative to the Eurozone. The federal funds rate stands now at 1.75-2 percent, while its longer-run estimations show 2.9 percent level, which implies just four more hikes. In contrast, the ECB has only announced to wind down its bond-buying program and it will not lift its interest rates before the summer 2019. Hence, the ECB is likely to start hiking when the Fed will run out of steam. It might be fundamentally bullish for the euro and possibly for gold as well in the medium term, however a lot will depend on the market sentiment.
