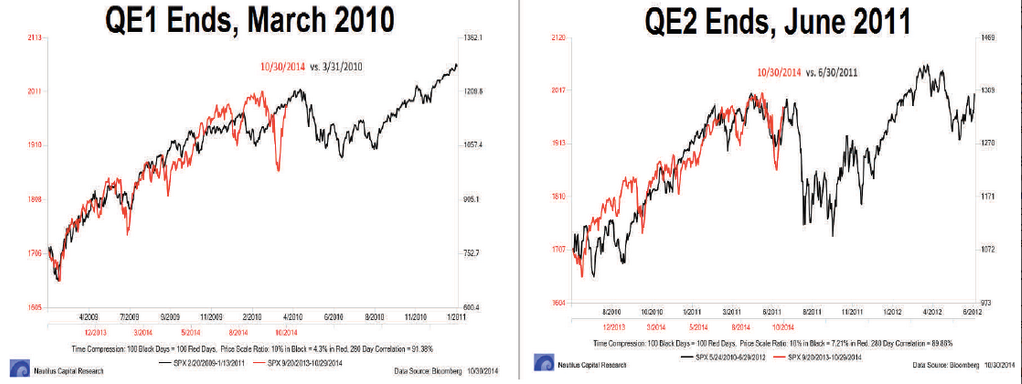
The Federal Reserve's third "quantitative easing" program officially ended last week. Many traders hold the view that equity markets have become addicted to central bank stimulus and that the end of QE 3 will therefore result in a significant fall in equities, just as the end of QE1 (2010) and QE2 (2011) corresponded with drops of 17-20% (chart from Nautilus).
It's valid to say that equity appreciation is out of proportion to actual growth. Since 2009, equities have appreciated 5 times faster than economic growth. The only other period where this happened was right after World War II (article). This expansion is the only one where annual GDP has yet to break above 3%.
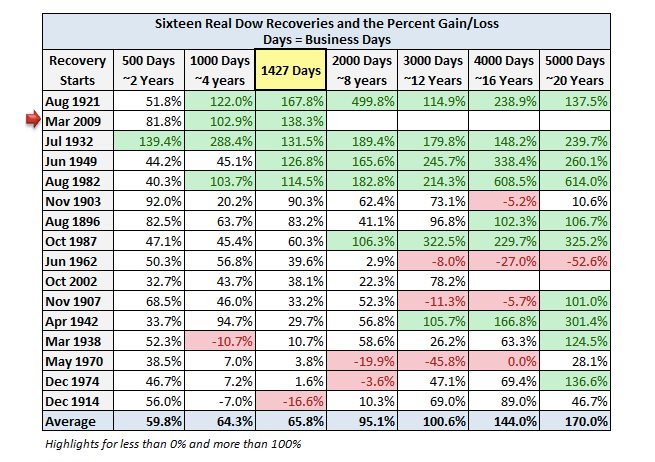
5-1/2 years into the bull market, US equities are up more to-date than every bull market in the past 100 years save the Roaring 20's; it's up more than during the bull markets in the 1950s, 1960s, 1980s or 1990s. The continued rise in equities is spectacular (chart from Doug Short).
Even so, a spectacular fall in equities, just due QE 3 ending, is not likely. Why? Because it's inaccurate to say that US equities fell in 2010 and 2011 simply because QE programs ended. In both cases, the real culprit was a negative surprise in macro growth.
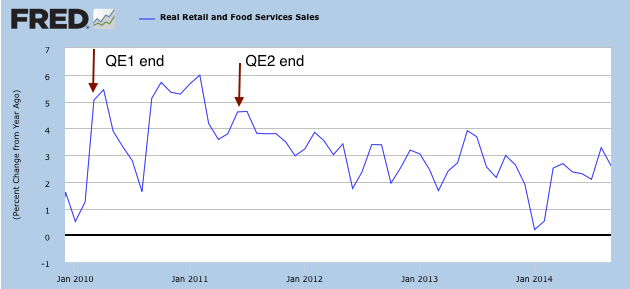
Recall, retail sales (a good proxy for total demand) fell right after both QE programs ended. Real annual growth had been ~5% in both cases; in early 2011, growth was 6%. This was the backdrop for the end of monetary stimulus. The drop in consumption in the ensuing months took the markets by surprise.
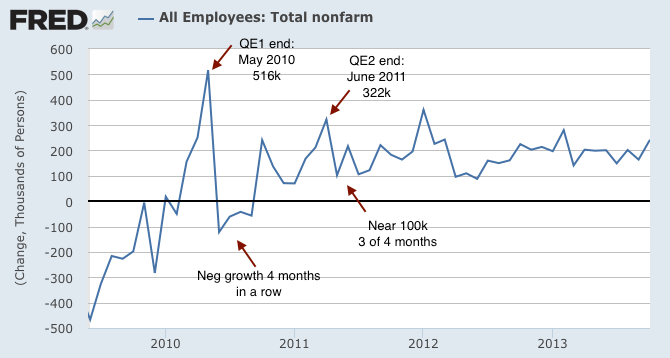
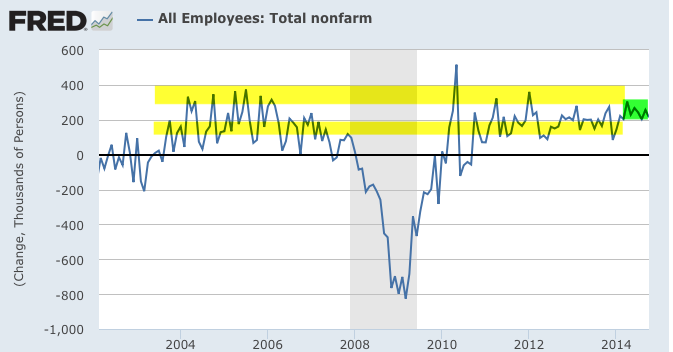
A similar drop occurred in employment data. By the end of QE1, NFP had rocketed to over 500k new employees (in comparison, the average the past 12 months has been 220k). That fell below zero the following 4 months. Again, when QE2 was ending, NFP had been over 320k; it fell to 100k in 3 of the next 4 months.
In August 2011, the deterioration in growth prospects prompted S&P to downgrade US credit ratings. SPX responded to the news with a 20% drop.
Traders' mantra that 'the stock market is not the same as the economy' is too simplistic. It's not everything, but there is a clear, close and logical relationship between equities and underlying fundamentals. Below, observe the correlation of SPX to annual retail sales.
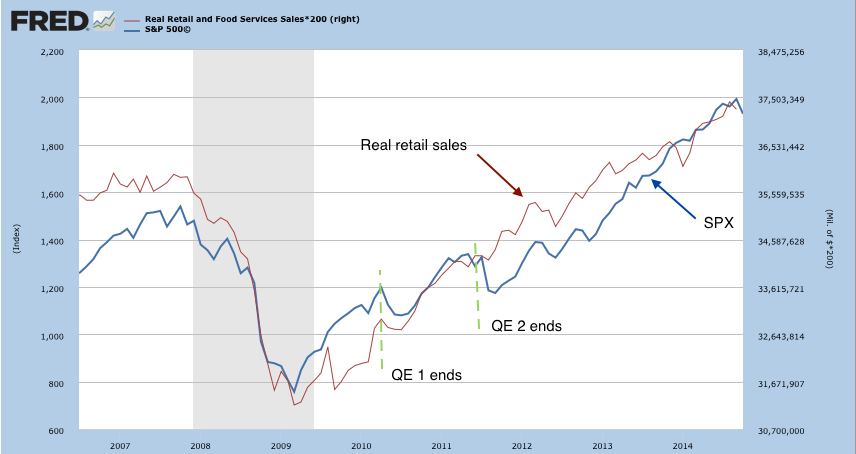
Which bring us to today. QE3 has ended. New POMO flows will not be added, but the Fed's balance sheet remains large ($4.5t) and it plans to reinvest principal payments. This is equal to about $5b in inflows every month.
But the more important point is that the catalyst for a fall in equities the last two times was macro deterioration, not the end of QE on its own. Surprises happen, but what has been noteworthy is how stable NFP has been so far in 2014. The pattern over the last 10 years has been for monthly prints to swing wildly between under 100k and over 300k per month. This year has seen neither extreme.
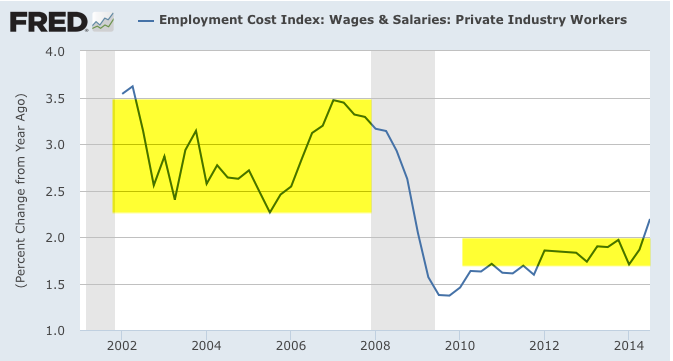
Moreover, the 3Q employment cost index rose to a post-recovery high of 2.2%. Compensation is still growing slowly, but this rise shows slack in labor markets are beginning to dissipate. Higher wages and more employment are the main drivers of consumption and thus economic growth.
To be clear, US growth remains tepid. It's been a slow recovery so far, and the rise in equities is well out of proportion. At the same time, growth in the rest of the world is slowing. Contrarians should note that sentiment data strongly suggests that investors are positioned for continued strong price appreciation (post).
These are the main risks to the market as it heads into 2015, not the end of the Fed's quantitative easing program.
