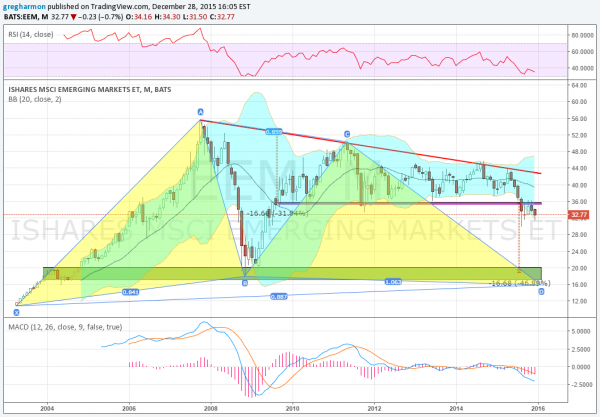
Emerging market stock markets had a horrible back half of 2015. The Emerging markets ETF (N:EEM) has lost 25% of its value since the April close. It fell out of a 6-year sideways consolidation and is ending the year at over 6-year lows. What a bad run. But it could just be getting started to the downside.
This long-term chart shows the monthly price action for the Emerging Market ETF since it was launched. After a 5-year run higher, it pulled back hard, losing 65% of its value. That was followed by a strong bounce and a 6-year sideways period.

Focusing closely on the chart, there are 5 important things to watch. The first three are related to where the price may head. The price action in that 6-year consolidation created a descending triangle. The break of the triangle to the downside gives a target of about 18.75. That's right in the middle of the consolidation range and support zones from 2004 and 2009 - item number two. The third is the bullish Bat harmonic. It has a Potential Reversal Zone (PRZ) at 16 below. This could morph into a Deep Crab, which would be much uglier.
Three strong indications that the 16-20 level in the ETF may be a stopping point. The last two are supporting indicators. The price fell out of the Bollinger Bands® when it broke the triangle lower. It has moved sideways since, but the Bollinger Bands are opening lower to allow for more downside. Finally the momentum indicators are bearish and falling, supporting more downside.
The prognosis for Emerging Markets really looks bleak from the charts, with potential for the price to be cut in half again. What would change this view? A move and close back over 36, back into the prior triangle, would be a change of character. Until then, this ETF is best viewed with a downward bias.
