Once a month, I assemble an economic forecast based on analysis of various data points which have led the economy. Historically, most of the time the economy trends up or trends down - but recently the economy simply has been frozen with little change in the rate of growth.
Follow up:
My view of the economy is at Main Street level - not necessarily GDP. My position is that GDP has disconnected from the real economy. A thinking person might say that GDP never projected the real economy - and it was never more obvious with the current situation where rate of change of growth slowed to a crawl. The jumping around of GDP in a flat economy is noticeable.
We will be releasing our economic forecast next week - and conditions have been flat (near the zero growth line) for three months. All indicators I view outside the elements of our forecast are mixed and confused. Nothing is strong.
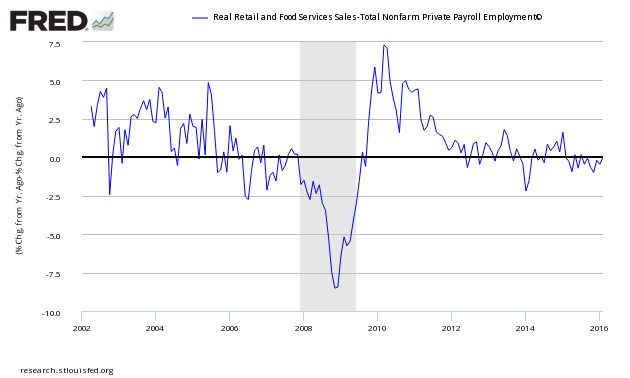
One of my favorite indicators to understand if the rate of economic growth is accelerating or decelerating is the relationship between the year-over-year growth rate of non-farm private employment and the year-over-year real growth rate of retail sales. This index is currently showing no growth differential. When retail sales grow faster than the rate of employment gains (above zero on the below graph) - the rate of growth of the economy is usually accelerating.
Growth Relationship Between Retail Sales and Non-Farm Private Employment - Above zero suggests economic expansion
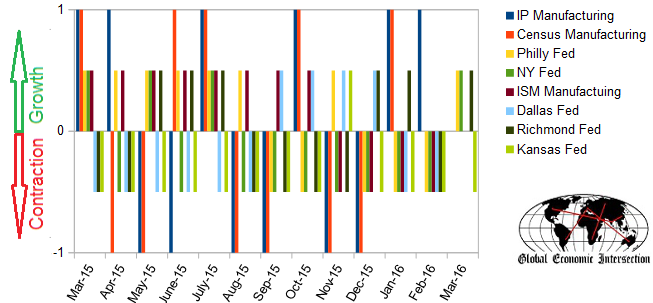
One observation this week is the continuing improvement in the regional Fed's manufacturing surveys where 3 of 4 regions are now showing manufacturing expansion. Manufacturing accounts for approximately 20% of the USA economy. I am not a fan of surveys, but when their indices jump into simultaneously - it makes you wonder.
Comparing Surveys to Hard Data:
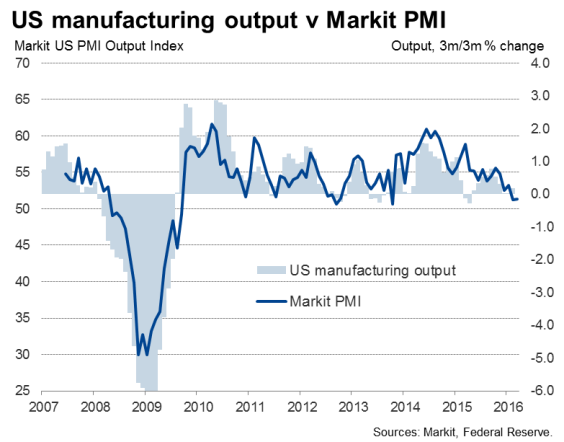
At the same time, Markit PMI headlines US manufacturing PMI rounds off worst quarter since mid-2012:
US factories continue to endure their worst spell for three-and-a-half years.
At 51.4, the seasonally adjusted Markit Flash PMI was up only fractionally from 51.3 in February. Moreover, at 51.7, the average PMI reading for the first quarter as a whole points to the weakest improvement over any quarter since the third quarter of 2012.
Confused? My position is that manufacturing likely has reached the bottom of its long decline in its rate of growth - but that does not necessarily translate into a rapidly improving manufacturing situation.
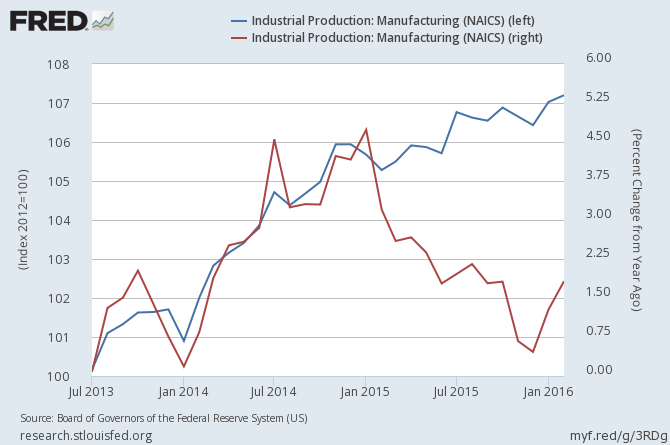
I am uneasy with the growth rate of the USA economy - it has as much chance of improving as declining based on the syntax of all the global events. This makes forecasting problematic - as a few well placed economic "bombs" can easily blow up any forecast.
Other Economic News this Week:
The Econintersect Economic Index for March 2016 marginally improved but remains relatively weak. The index continues at one of the lowest values since the end of the Great Recession. It remains to be seen if this improvement is a reversal of the long term decline of our index since late 2014.
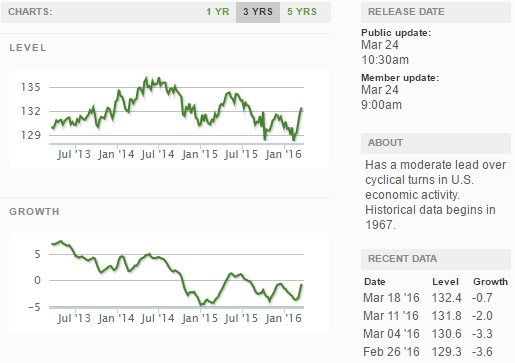
Current ECRI WLI Growth Index
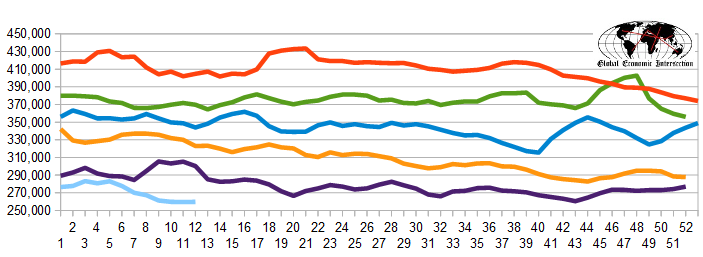
The market expectations (from Bloomberg) were 260,000 to 272,000 (consensus 268,000), and the Department of Labor reported 265,000 new claims. The more important (because of the volatility in the weekly reported claims and seasonality errors in adjusting the data) 4 week moving average moved from 259,500 (reported last week as 268,000) to 259,750. The rolling averages generally have been equal to or under 300,000 since August 2014.
Weekly Initial Unemployment Claims - 4 Week Average - Seasonally Adjusted - 2011 (red line), 2012 (green line), 2013 (blue line), 2014 (orange line), 2015 (violet line)
Bankruptcies this Week: Blue Earth and Blue Earth Tech, Emerald Oil, Quantum Fuel Systems Technologies Worldwide
Click here to view the scorecard table below with active hyperlinks
Weekly Economic Release Scorecard:
