The Federal Reserve’s FOMC believes the economy’s rate of expansion is improving. It is not that the economy MAY be expanding at a faster rate – but the evidence is mixed to negative at this point. As usual, my view is using the unadjusted data whilst most only read the headlines.
The defect in my approach is that the unadjusted data is usually much more noisy (big month-over-month variation) which takes a least 3 months to confirm a trend. The talking heads, on the other hand – rely on an adjusting methodology which continues to overstate the month-over-month gains.
Retail sales is the major dividing factor in the view whether the economy is improving. The economy is approximately 2/3rds driven by the consumer, and retail sales is a good proxy for consumer spending. The blue line in the chart below shows the headline number which indicates a gradually improving sector in the last 9 months following a decline from early 2011. The red line is growth using the unadjusted data set which shows a declining growth rate continuing for the last 12 months following a spike in early 2012.
Comparison of the Year-over-Year Census Seasonally Adjusted Retail Sales (blue line) and Econintersect’s Unadjusted Retail Sales (red line)
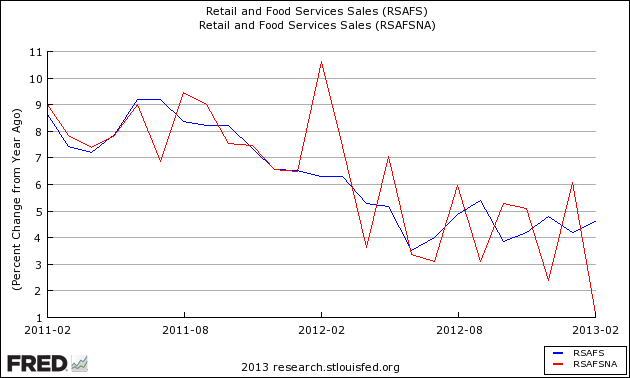
Neither line in the above retail sales growth chart is inflation adjusted – and with inflation running around 2%, one’s perspective of retail sales is degraded. It is inflation adjusted sales which are used in determining GDP.
Comparison of Real Year-over-Year Growth between FRED’s Real Retail Sales (green line) and Econintersect’s Inflation Adjusted Retail Sales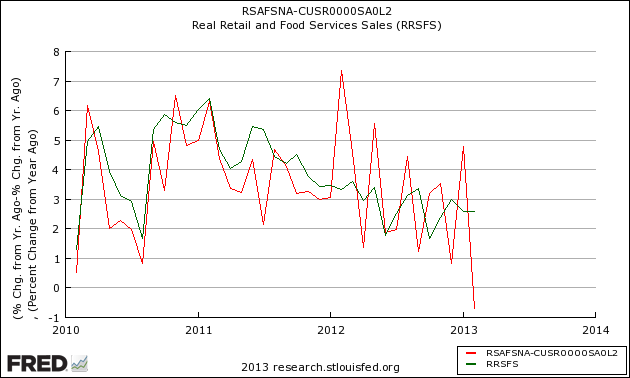
A note on FRED’s Real Retail Sales – it adjusts for inflation the already seasonally adjusted data.
The manufacturing portion of Industrial Production is not confirming a strengthening of the economy. The manufacturing portion of industrial production has a high correlation to economic activity.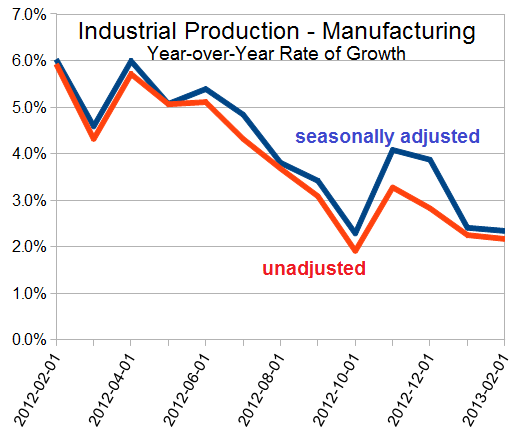
Employment is a lagging indicator, and I continue to hear how the labor market is improving. This is an interesting opinion since the rate of growth continues to degrade. Note that the graph below uses seasonally adjusted data.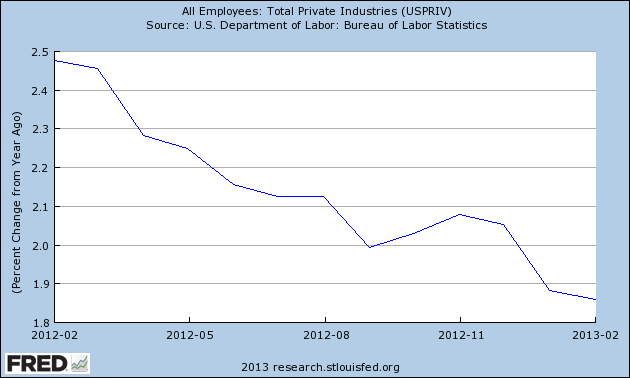
Others see recent improving growth in Residential Construction. This sector is growing relatively strongly in comparison to the other sectors of the economy – but the rate of growth is not improving.
Unadjusted Year-over-Year Change New Homes -Permits (blue line) and Construction Completions (red line)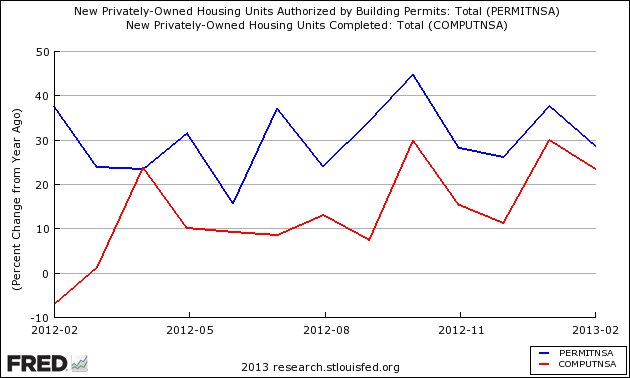
There are indicative elements of the economy which are showing improving growth rates – but these elements historically need confirmation by other elements (which have not yet occurred).
The bottom line is their is little basis to start celebrating that the economy is improving.
Other Economic News this Week:
The Econintersect economic forecast for March 2012 continues to show weak but somewhat improving growth. This followed a period of several months where we saw the rate of growth weakening The supply chain contraction we saw last month has dissipated putting all of our check points for measuring the economy clearly in expansion territory.
ECRI now believes a recession began in July 2012. ECRI first stated in September 2011 a recession was coming . The size and depth is unknown. The ECRI WLI growth index value has been weakly in positive territory for over three months – but in a noticeable improvement trend. The index is indicating the economy six month from today will be slightly better than it is today.
Current ECRI WLI Growth Index
Initial unemployment claims fell from 340,000 (reported last week) to 332,000 this week. Historically, claims exceeding 400,000 per week usually occur when employment gains are less than the workforce growth, resulting in an increasing unemployment rate (background here and here).
The real gauge – the 4 week moving average – also improved from 348,750 (reported last week) to 346,750. Because of the noise (week-to-week movements from abnormal events AND the backward revisions to previous weeks releases), the 4-week average remains the reliable gauge.
Weekly Initial Unemployment Claims – 4 Week Average – Seasonally Adjusted – 2011 (red line), 2012 (green line), 2013 (blue line) 
Bankruptcies this Week: Dex One (fka R.H. Donnelley Corporation), School Specialty,
Data released this week which contained economically intuitive components (forward looking) were:
- Rail movements are somewhat improving.
Weekly Economic Release Scorecard:
Click here to view the scorecard table below with active hyperlinks

