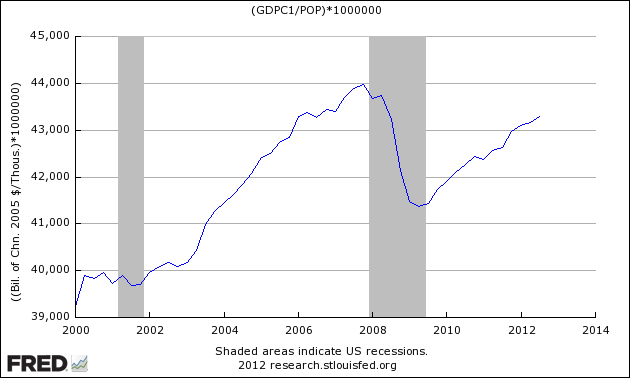
I am not a lover of GDP as THE measure of the economy. GDP measures money movement across sectors of the economy that economists have determined is “productive” growth. Nothing is wrong with GDP as “one of many” economic measures which can be used – but it is not an all knowing measure of an economy.
When you use any broad measure, at times it misleads.
Broad lagging measures of the economy such as GDP show recovery and a return to prosperity [please, I know growth is slowing and we are running at the edge of a "fiscal cliff"]. The above graph shows GDP per capita, and if trends were to hold – within a year the “average” American should be as well off as before the Great Recession.
An “average” is adding up all the numbers, then dividing by how many numbers there are. The median is the central point of a data set – or the middle numbers in a sorted list of numbers. As an example, a data set of 20000, 20000, 20000, 20000 and 3000000 would have an average of 616,000, but a median of 20,000.
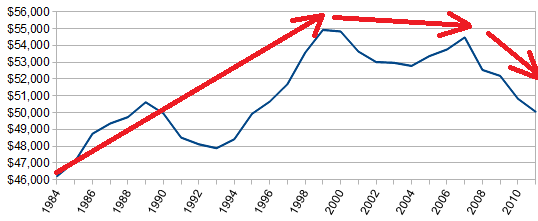
The data from the recently released US Census American Community Survey updated through 2011 shows a completely different view of the “average” American family income using median income.
Median Family Income in Expressed in Chained 2011 dollars from the American Community Survey 
Who is this median family? – It is our beloved Joe Sixpack’s family. Joe and his family have been becoming poorer for the entire 21st century – and financially no better off than 25 years ago. When the median is lower than the average, it generally means that the upper incomes are distorting income distribution.
The basic design of the USA society and economy was based on the principles of prosperity:
We the People of the United States, in Order to form a more perfect Union, establish Justice, insure domestic Tranquility, provide for the common defence, promote the general Welfare, and secure the Blessings of Liberty to ourselves and our Posterity, do ordain and establish this Constitution for the United States of America.
But alas, my friend Joe Sixpack is letting down the Constitution of the United States – he is not achieving prosperity. It appears there is a big difference between taking a broad measure (such as GDP) and dividing it by population to find an average – and thinking things are improving, or taking a median – and seeing that they are not.
My point in penning this post is that the American economy is geared to Joe Sixpack consuming. But Joe is being starved, and yet asked to produce and consume – much like the farmer who does not feed his horse enough but wants it to plow ever increasing areas. The USA economic dynamics are preventing Joe from getting enough income to increase consumption.
The government has decided it cannot hand money to Joe and his family; supply side economics is dead out of the gates with such massive capacity slack; government austerity measures effect disproportionally the 90%; and taxing the 1% pulls money out of the economy for the only sector that is consuming (likely creating less jobs).
The USA has an economic gearing issue. Consider this when you listen to the rhetoric over the ‘fiscal cliff’, that taking more money from the 1% really rich people who are doing really well and consuming – and not even redistributing it to the 99% – how does that make the economy better? [Note: I do not believe wealth redistribution as an economic strategy - but it is better than only taking money from the rich and keeping it].
Likely the “compromise” that results over the fiscal cliff will slow the economy further, resulting in lower tax revenues than projected, making the debt crisis worse. The American problem is much larger than taxation or spending – but gearing. Gearing is the sum of the effects of regulation, laws and taxation – all coupled to national and global balances.
The economy is geared for something it is not – and choking Joe Sixpack in the process.
Other Economic News this Week:
The Econintersect economic forecast for November 2012 showed barely moderate growth, but the the underlying data used to forecast was very mixed. To use a technical term – the data was wacky, and as an analyst leaves me with an uncomfortable feeling. However, the good data was stronger than the bad data, and our alternate forecasting tools validated our forecast.
ECRI is still insisting a recession is here (a 07Sep2012 post on their website). ECRI first stated in September 2011 a recession was coming . The size and depth is unknown. The ECRI WLI growth index value is enjoying its twelfth week in positive territory. The index is indicating the economy six month from today will be slightly better than it is today.
Current ECRI WLI Growth Index 
Initial unemployment claims jumped massively from 355,000 (reported last week) to 439,000 this week. Analysts have attributed the jump to Hurricane Sandy. Historically, claims exceeding 400,000 per week usually occur when employment gains are less than the workforce growth, resulting in an increasing unemployment rate (background here and here). The real gauge – the 4 week moving average – rose significantly from 370,500 (reported last week) to 383,750. Because of the noise (week-to-week movements from abnormal events AND the backward revisions to previous weeks releases), the 4-week average remains the reliable gauge.
Weekly Initial Unemployment Claims – 4 Week Average – Seasonally Adjusted – 2010 (blue line), 2011 (red line), 2012 (green line) 
Bankruptcies this Week: Vyteris, Privately-held Metex Mfg. Corporation (fka Kentile Floors), AMF Bowling Worldwide, Latitude Solutions, Overseas Shipholding Group (OSG), Helicos BioSciences
Data released this week which contained economically intuitive components (forward looking) were:
- Rail movements (where the economic intuitive components indicate amoderately slightly expanding economy).
- Industrial Production
All other data released this week either does not have enough historical correlation to the economy to be considered intuitive, or is simply a coincident indicator to the economy.
Click here to view the scorecard table below with active hyperlinks.
Weekly Economic Release Scorecard:
