Before I comment on the charts, a note about the US Oil Fund ETF USO (NYSE:USO).
News is news, and clearly, it’s not been good.
But charts are better.
With two huge volume days in a row and prices that tanked, a blow off bottom is not an impossibility. In fact, in my experience, the PTSD from the news far outlasts bottoming technical patterns.
And in this case, after 2 blow off volume days with huge price declines, watch for a green day close, which could signal the worst is over for the ETF.
Now on to our Economic Modern Family.
I am showing you the weekly charts yesterday, as I will be taking Wednesday to Friday off for a bit of a much-needed rest. This will be the last Daily until Monday. However, Keith will have a weekend Market Outlook available to you on Sunday.
The information I am sharing with you should help give you guiding parameters for the rest of the week.
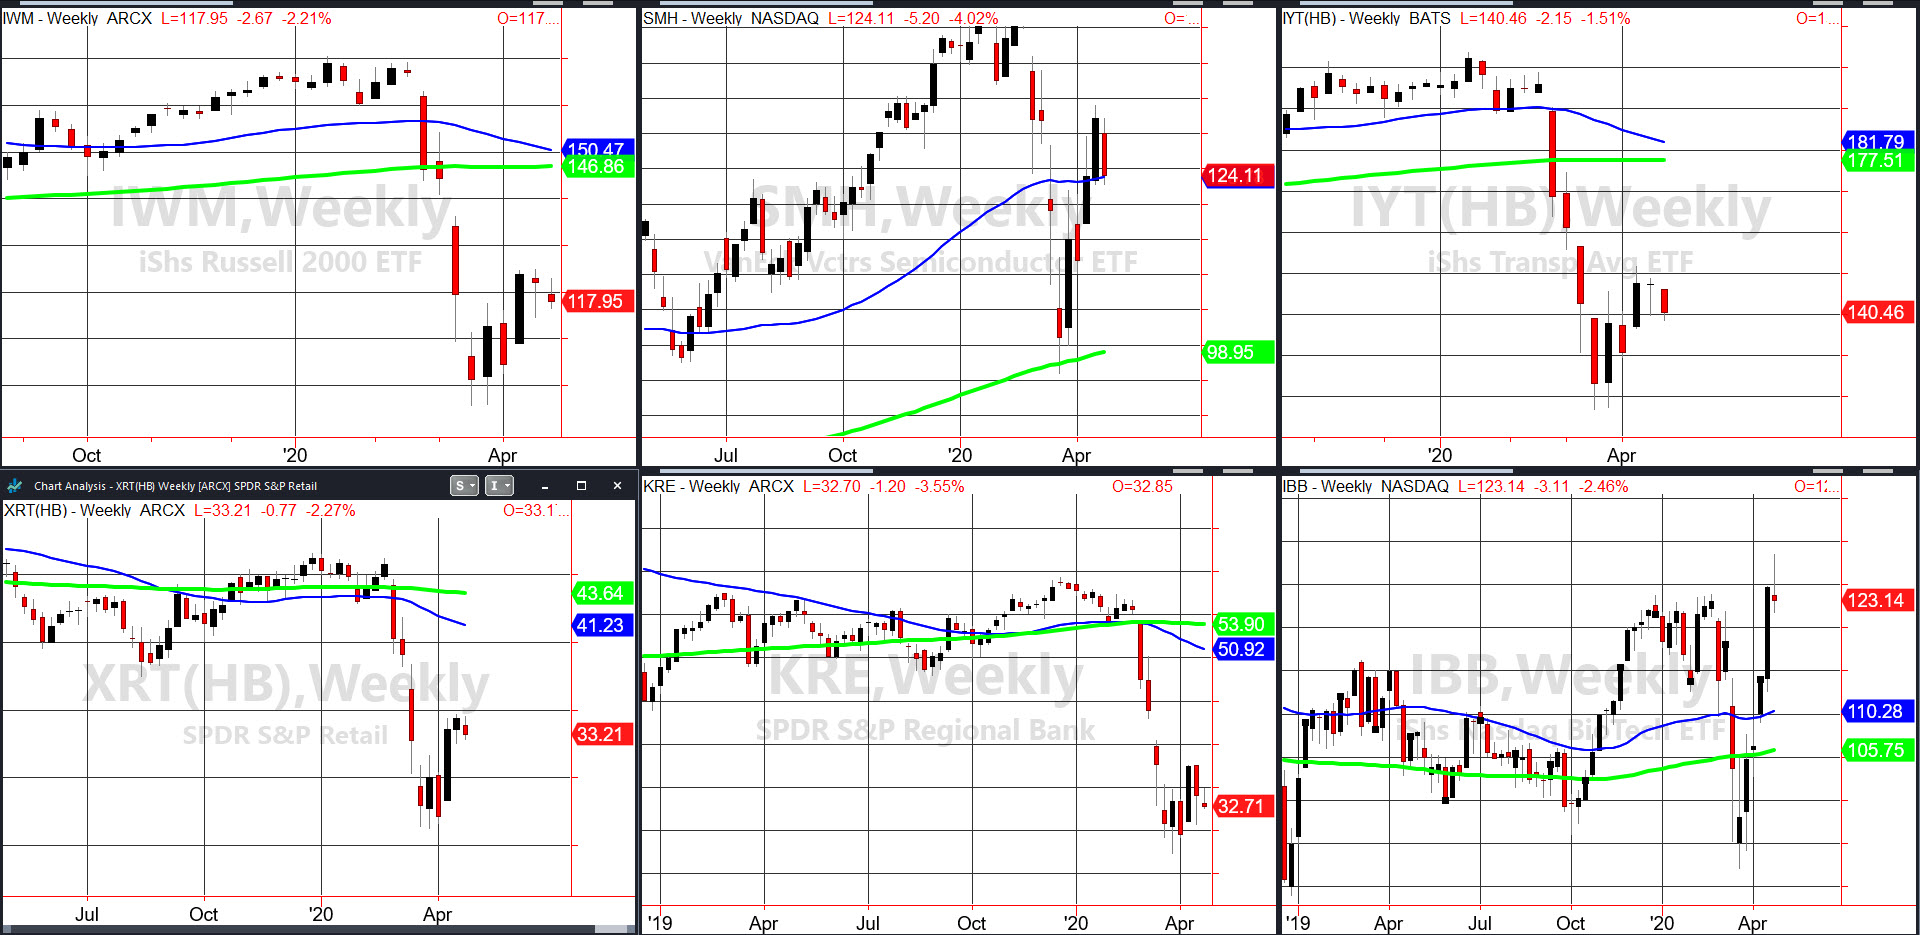
Make no mistake, these charts, with the exception of IBB, are not healthy looking.
The top left chart is the Russell 2000 IWM. With an inside week in the making, under last week’s low or 114.56, next support is 113.24 or the opening levels of the prior week. Should that fail, IWM is headed towards 102.
Over 124.88, a move towards 134 is not out of the question.
Top middle is Semiconductors SMH. In a bullish phase, this is your best place to go if the market rallies from here. With an inside week, if SMH fails to hold 122.78, extreme caution all around.
Top right is Transportation IYT. I feel like I have not mentioned this sector in awhile. Nonetheless, until it breaches 150, the overall weakness prevails. Under 138, expect a move closer to 131.
Bottom left is Retail XRT. Also with an inside week, XRT looks better over 35.00 with a move to 40.00 possible. Under 32.50, XRT can head south to 30.00.
Bottom Middle is Regional Banks KRE. Another inside week, KRE has to clear 37.52 to see a move to 43.00. Or, under 30.50, it will drag the rest of the Family down with it.
Last is Big Brother Biotechnology IBB. Monday, it made a new 5-year high but not an all-time high. In 2015, IBB peaked at 133.60. Since then, the last swing high was in late 2019 at 123.75. That makes that level pivotal as we go through the rest of week. Last week’s high is also important at 124.77.
The bullish phase is strong, as both slopes on the 50 and 200-week moving averages are up, making this sector another place to look for longs if the market holds up.
Elsewhere, with lots of calls for deflation, I saw the agricultural ETF DBA outperform, along with beans and wheat. Watch those as well, to see if a trend emerges.
I hope you have a great rest of your week.
S&P 500 (SPY) 277.50-280 Resistance with 270 then 265.50 best support
Russell 2000 (IWM) inside week. Under 114.56, next suppport is 113.24. Should that fail, IWM see 102. Over 124.88, can see 134
Dow (DIA) 235 resistance then 237.45. Support 225-226
Nasdaq (QQQ) 203.65 the 50-DMA, then support 198. Over 213.30 better
KRE (Regional Banks KRE) 37.52 resistance 30.50 support
SMH (Semiconductors) inside week, if SMH fails to hold 122.78, extreme caution all around.
IYT (Transportation) until it breaches 150, the overall weakness prevails. 138 support then 131.
IBB (Biotechnology) 123.75 pivotal and better over 124.77.
XRT (Retail) over 35.00 see 40.00. Under 32.50, see 30.00.
Volatility Index (VXX) 45.00 support to hold
Junk Bonds (JNK) 96 support to hold. 98.50 resistance
LQD (iShs iBoxx High yield Bonds) 129.25 pivotal
