🥇 First rule of investing? Know when to save! Up to 55% off InvestingPro before BLACK FRIDAYCLAIM SALE

The Dollar's Had Its Fun But Now Appears Set For A Pullback

Published 11/15/2019, 12:14 AM
EUR/USD
-
GBP/USD
-
USD/JPY
-
AUD/USD
-
USD/CAD
-
DX
-

So far, USD is on track for a positive close in November, a month which has historically been favourable to bulls. Yet nothing moves in a straight line and it appears bears could now have their say.
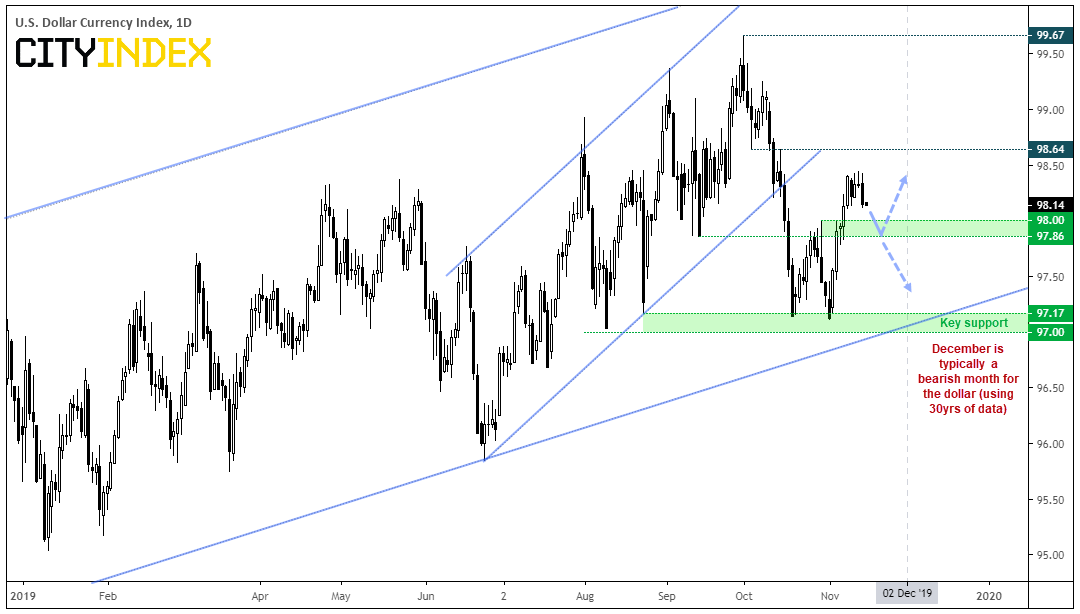
USD Index Daily Chart

DXY: A bearish outside day has formed and price action appears poised to retest the support zone around 97.86-98.00. Given the strength of bullish momentum from the 97 support one, the bias is for a minor pullback and for DXY to head towards 98.64 resistance.

However, as previously noted, whilst November is typically a bullish month for the dollar, December is typically bearish. As seasonality is merely a tendency, their timing is not perfect which leaves potential for the patterns to shift forward or backwards in time. So, whilst price action on DXY (US dollar index) shows potential for a correction against its recent gains over the near-term, we should also consider the potential for December’s weak dollar tendency to creep into late November.

As we head into next week, a few currencies could now benefit form a weaker dollart over the near-term.
  • USD/CAD printed a bearish pinbar on the daily chart and has broken beneath its low in Asia
  • GBP/USD may have completed an ABC correction at 1.2769 and is now on the cusp of testing its correction line around 1.2885 – a break higher suggests it could be headed back for the highs around 1.30.
  • AUD/USD is retracing from its lows after yesterday’s weak employment print. That said we remain bearish on AUD/USD given the strength of the bearish move yesterday, but there is potential for prices to at least consolidate, if not retrace further, ahead of its next leg lower.
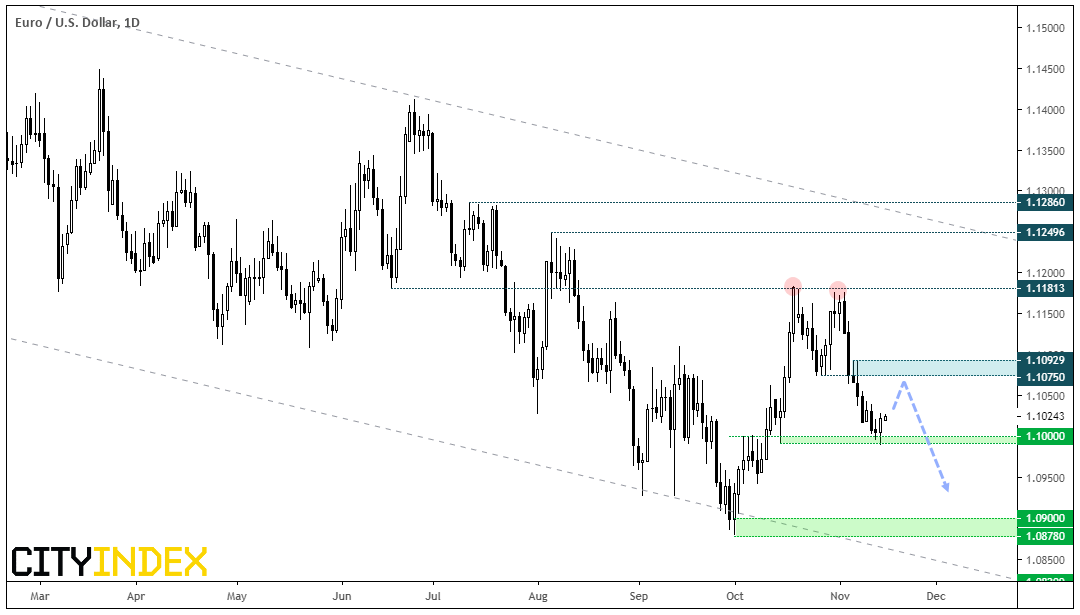
  • EUR/USD Daily Chart

    EUR/USD: A bullish outside bar has formed ~1.1000 and its failed, intraday attempt to break this key level adds further weight to the support level. Given it has fallen -1.6% over the past 7 sessions, it appears ripe for a correction which paints a bullish bias over the near-term.
  • Bias is bullish whilst prices remain above this week’s low (1.0989), and bulls could target the resistance zone around 1.1075-1.1093.
  • Bears could seek to fade into rallies beneath the resistance zone, ideally after signs of weakness appear (look for bearish RSI divergences on lower timeframes or signs of a top on price action).
  • A break beneath this week’s low assumes bearish trend continuation and bring the lows around 1.0900 into focus.
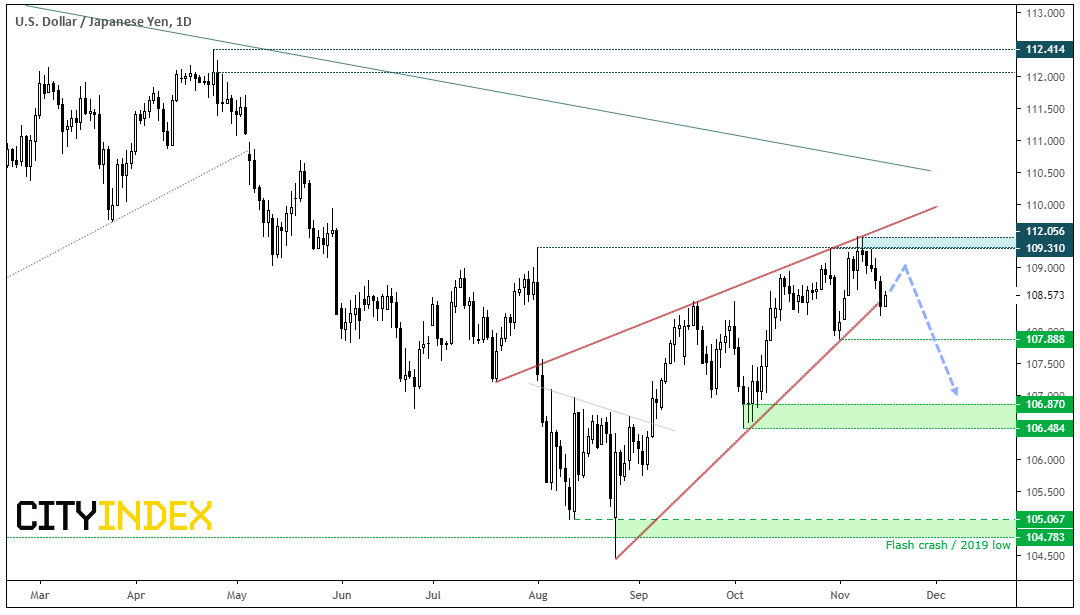
  • USD/JPY Daily Chart

    USD/JPY: The potential for a bearish wedge remains very much alive and well. After two failed attempts to break 109.31 over two consecutive days, prices rolled over and left a 2-ber reversal at the highs. Price action closed beneath the lower trendline of the wedge formation, so it possible we have seen the high at 109.48. However, rarely do such patterns play nicely with ‘textbook perfect’ trendline, so be prepared for some noise around current levels.

  • Bias remains bearish beneath 109.48, although bears could consider fading into rallies beneath 109 (round number) and target the 107.90 low. A break beneath here brings the lows ~106.50 into focus.
  • If prices provide a small rebound, signs of a lower high add weight to the argument that we’ve seen the top at 109.48.
  • If successful, the target projects a pattern near the base of the wedge around 104.50-105.00.
  • Original Post

    Latest comments

    Loading next article…
    Risk Disclosure: Trading in financial instruments and/or cryptocurrencies involves high risks including the risk of losing some, or all, of your investment amount, and may not be suitable for all investors. Prices of cryptocurrencies are extremely volatile and may be affected by external factors such as financial, regulatory or political events. Trading on margin increases the financial risks.
    Before deciding to trade in financial instrument or cryptocurrencies you should be fully informed of the risks and costs associated with trading the financial markets, carefully consider your investment objectives, level of experience, and risk appetite, and seek professional advice where needed.
    Fusion Media would like to remind you that the data contained in this website is not necessarily real-time nor accurate. The data and prices on the website are not necessarily provided by any market or exchange, but may be provided by market makers, and so prices may not be accurate and may differ from the actual price at any given market, meaning prices are indicative and not appropriate for trading purposes. Fusion Media and any provider of the data contained in this website will not accept liability for any loss or damage as a result of your trading, or your reliance on the information contained within this website.
    It is prohibited to use, store, reproduce, display, modify, transmit or distribute the data contained in this website without the explicit prior written permission of Fusion Media and/or the data provider. All intellectual property rights are reserved by the providers and/or the exchange providing the data contained in this website.
    Fusion Media may be compensated by the advertisers that appear on the website, based on your interaction with the advertisements or advertisers.
    © 2007-2024 - Fusion Media Limited. All Rights Reserved.