A diamond starts as a dirty unshaped rock. It gets polished and then cut. The shape of that Diamond then has many facets. And those facets come in many different shapes, and sizes depending on how the jeweler wishes to cut the stone to bring the best light and set a pattern of reflection and refraction to it. Hexagons, triangles, squares and more. It is all designed about attracting attention.
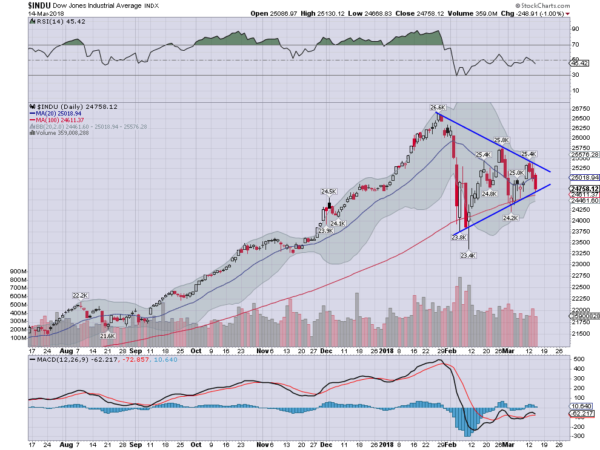
In the stock market there are Diamonds with shapes as well. The Dow Jones Industrial Average (NYSE:DIA) ETF is known as the Diamond. It has been a leader attracting a lot of attention recently as it pulls back. And that pullback has built its own triangle. Another Diamond Triangle. The chart below shows the picture.
A rise out of a base in September continued to a top at the end of January. It pulled back hard and fast to the 100 day SMA from there. Bounce brought it back over the 20 day SMA and then it stalled at a lower higher. Another test back at the 100 day SMA followed, a higher lower. The triangle is building. Another touch at the top of the triangle and then reversal leaves the DJIA at the lower rail of the triangle, and a total of 6 touches of its bounds.
This is a critical juncture. It is just past the power zone of 2/3 of the way through the triangle, and a break of it would look for a move of about 2700 points. To the downside that would mean a new lower low. And to the upside a new all-time high. Which will it be?
DISCLAIMER: The information in this blog post represents my own opinions and does not contain a recommendation for any particular security or investment. I or my affiliates may hold positions or other interests in securities mentioned in the Blog, please see my Disclaimer page for my full disclaimer.

