I started writing on the economy because I was horrified with the biased analysis being pumped out by pundits. Even today, most analysis I read is either a simple regurgitation of the government's spin on the data or a cherry picking of data points to present an overly positive or overly negative view. I can count on one hand those which try to provide real balanced data analysis.
Follow up:
I have always believed with real facts you can make the best decisions. However, there are many issues which are not being accurately tracked which results in too many decisions which are based on anecdotal or circumstantial information.
There seems little discussion of a possibility of a recession. My belief is, that based on the way recessions are determined, there is close to a zero chance of a recession. Even ignoring the way the BEA determines GDP, and using my own methodology which uses counts of "things" and not money (so inflation is not an issue) - there is no trend line currently which leads one to suspect a recession is coming.
Yet, there are a few recession flags you should be aware.
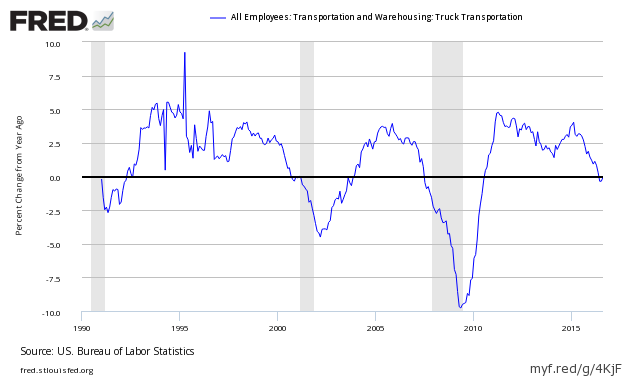
Trucking employment is contracting year-over-year.
One of our litmus test recession indicators is trucking employment - which is continuing in recession territory for the second consecutive month. Consider that rail movements. industrial production, and wholesale trade are all in contraction. Prior the Great Recession, this was a 100% guarantee that a recession is underway. In 2016, it does not appear AT THIS POINT that a recession in this economic sector will drag the economy into a recession - unless a knock-on affect begins to ripple into employment or construction.
The US Government's Income Is In Contraction
Last week I wrote on the spun 5.2% median family income increase. Tell me how this squares with government receipts being in contraction - when 75% of the government's income comes families like yours and mine?
Year-over-Year Change in US Government Receipts - Monthly (blue line) and Three Month Rolling Average (red line)

Source: US Treasury, author calculations
Three month rolling average is the way to view this data as there is significant variation monthly. And let us not miss the 2 year growth rate down trend of income since January 2013.
How do I put this puzzle together?
Too many people believe data MUST come together neatly. Outliers do NOT necessarily mean that data is corrupted, or there are methodology issues, or the data is subject to "spin". Life is messy, and does not often fall into neat patterns. We never may be able to create a accurate dynamic model of the economy so we may be stuck with varying degrees of subjectivity. So, in the words of Taylor from Kid Nation, "deal with it".
I put outlying data into a part of my brain I am able to recall if I find other data points where this outlier fits neatly into that puzzle.
Bankruptcies this Week: Rock Creek Pharmaceuticals Inc (OTC:RCPI) (f/d/b/a Star Scientific and Eye Technology),Cosi Inc (NASDAQ:COSI)
Click here to view the scorecard table below with active hyperlinks
Weekly Economic Release Scorecard:

