Think of a company’s stock market capitalization as the present value of investor expected future cash flows. There are two ways this number can rise or fall.
The first is related to the numerator, expected cash flows. For instance, expected cash flows can change when news arrives that affects investor expectations regarding the outlook for the company’s business.
The second is the denominator, the discount rate. The discount rate equals the current risk free rate, usually approximated by the 10-year Treasury rate, plus a premium for risk. The size of the risk premium depends critically on investor appetites for risk.
When investor sentiment is high, concern over risk falls, and the discount rate drops. The result is an increase in stock prices. Just the reverse occurs when sentiment drops, fear increases, the risk premium rises, and stock prices fall.
The Paradox Of A Rising Market's Dark Side
Though this may seem like technical jargon, it turns out to be critically important for investors. It also involves an interesting paradox which points to the dark side of a rising stock market.
To illustrate, the charts below are based on a simple calculation involving a hypothetical stock during the bull market of the last 12 years. (The spreadsheet calculations are available to download from Cornell Capital Group.)
The calculation assumes that over the last 12 years, as investor confidence and risk appetites rose during the long bull market, the discount rate continuously fell from 7% to 5%.
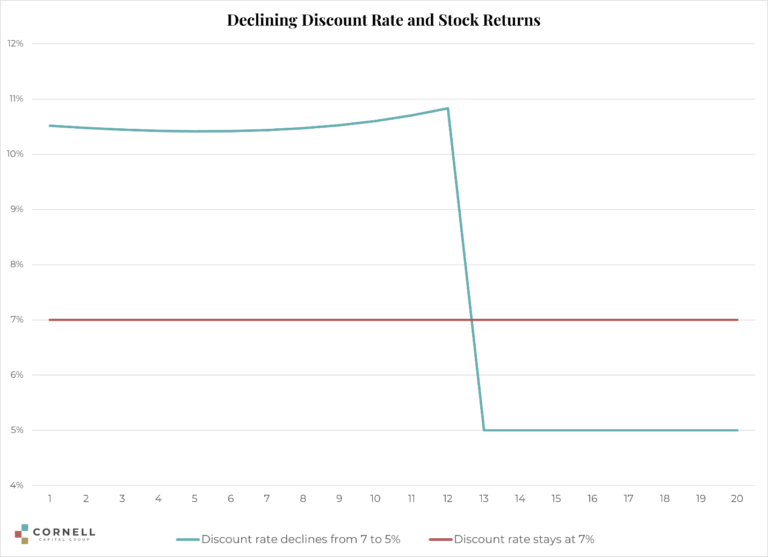
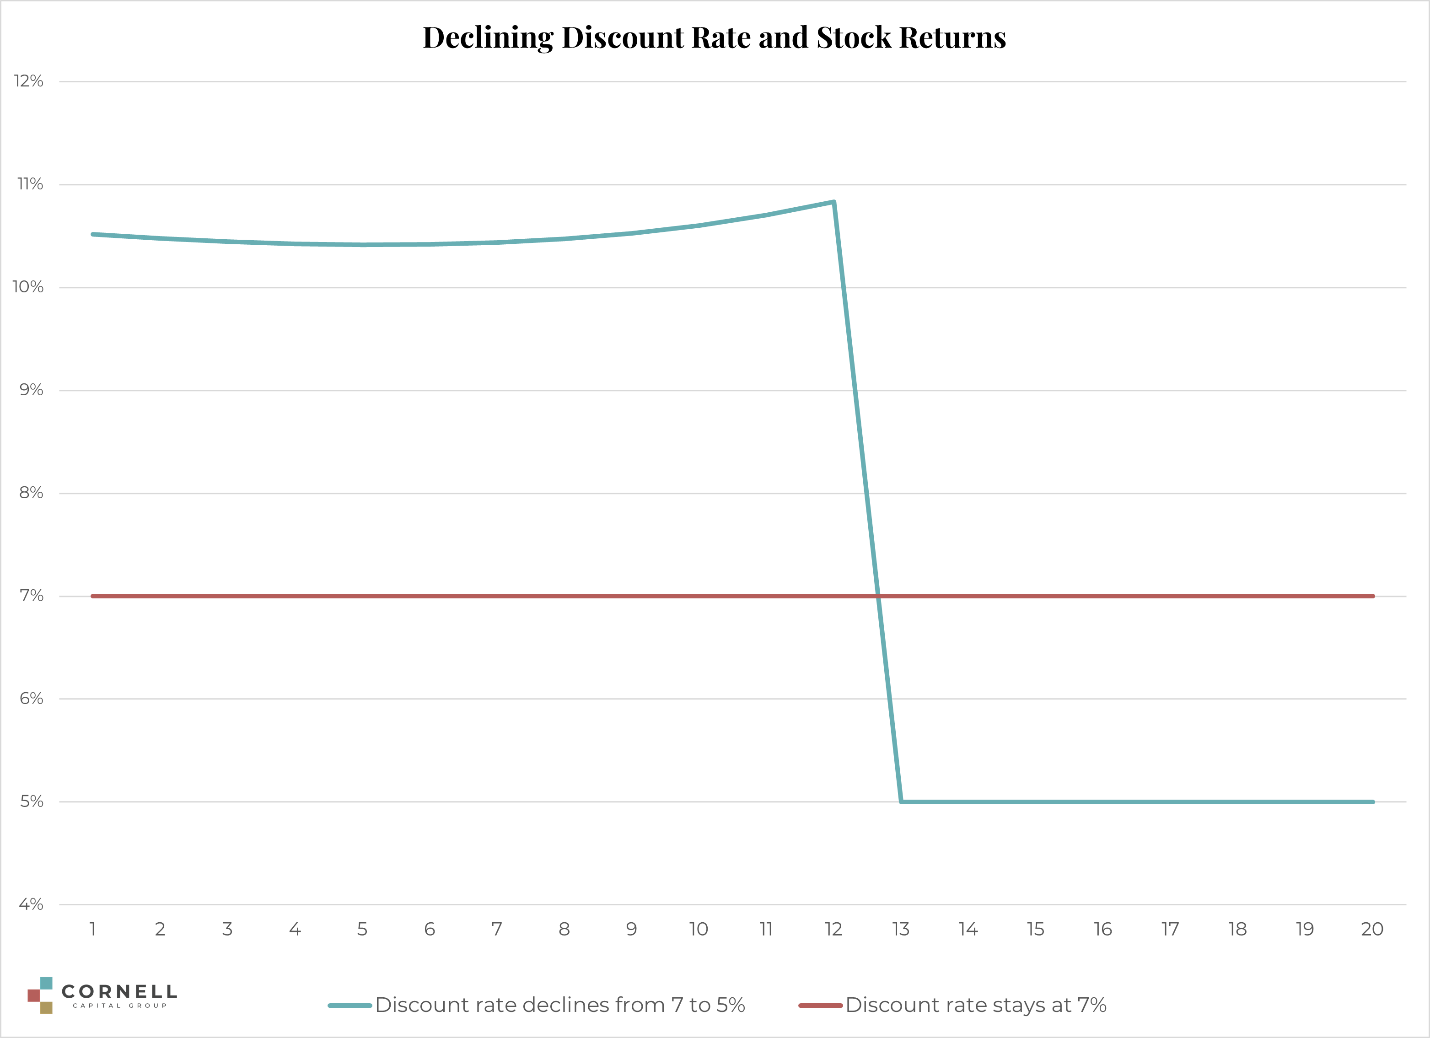
It is assumed that nothing else changes. To interpret the exhibits, recall that in market equilibrium, the expected return on stocks equals the discount rate. For instance, the red line in the first exhibit shows that if the discount rate stayed at 7%, investors could have expected to earn 7% per year during the 12-year period.
However, if the discount rate falls, that is if the returns investors can expect on stocks going forward drops, the prices of stocks experience as a one-time gain. If the discount rate drops again, there is another one time gain, and so forth, until the discount rate stops falling. At that point, future expected returns equal the new lower discount rate.
In the calculations underlying the chart below, the discount rate is assumed to fall 0.167% each year, so that over the course of 12 years it drops to 5.00% from 7.00%.
Using that assumption, the chart plots as the green line what the returns would be on a typical stock during and following a period of declining discount rates. The exhibit shows that during the 12 years when the discount rate is falling, the return on the hypothetical stock is over 10.50% per year.
But once the discount rate stops declining, future returns drop to 5%, less than the 7% that would have been expected prior to the drop in the discount rate.

The Falling Discount Rate
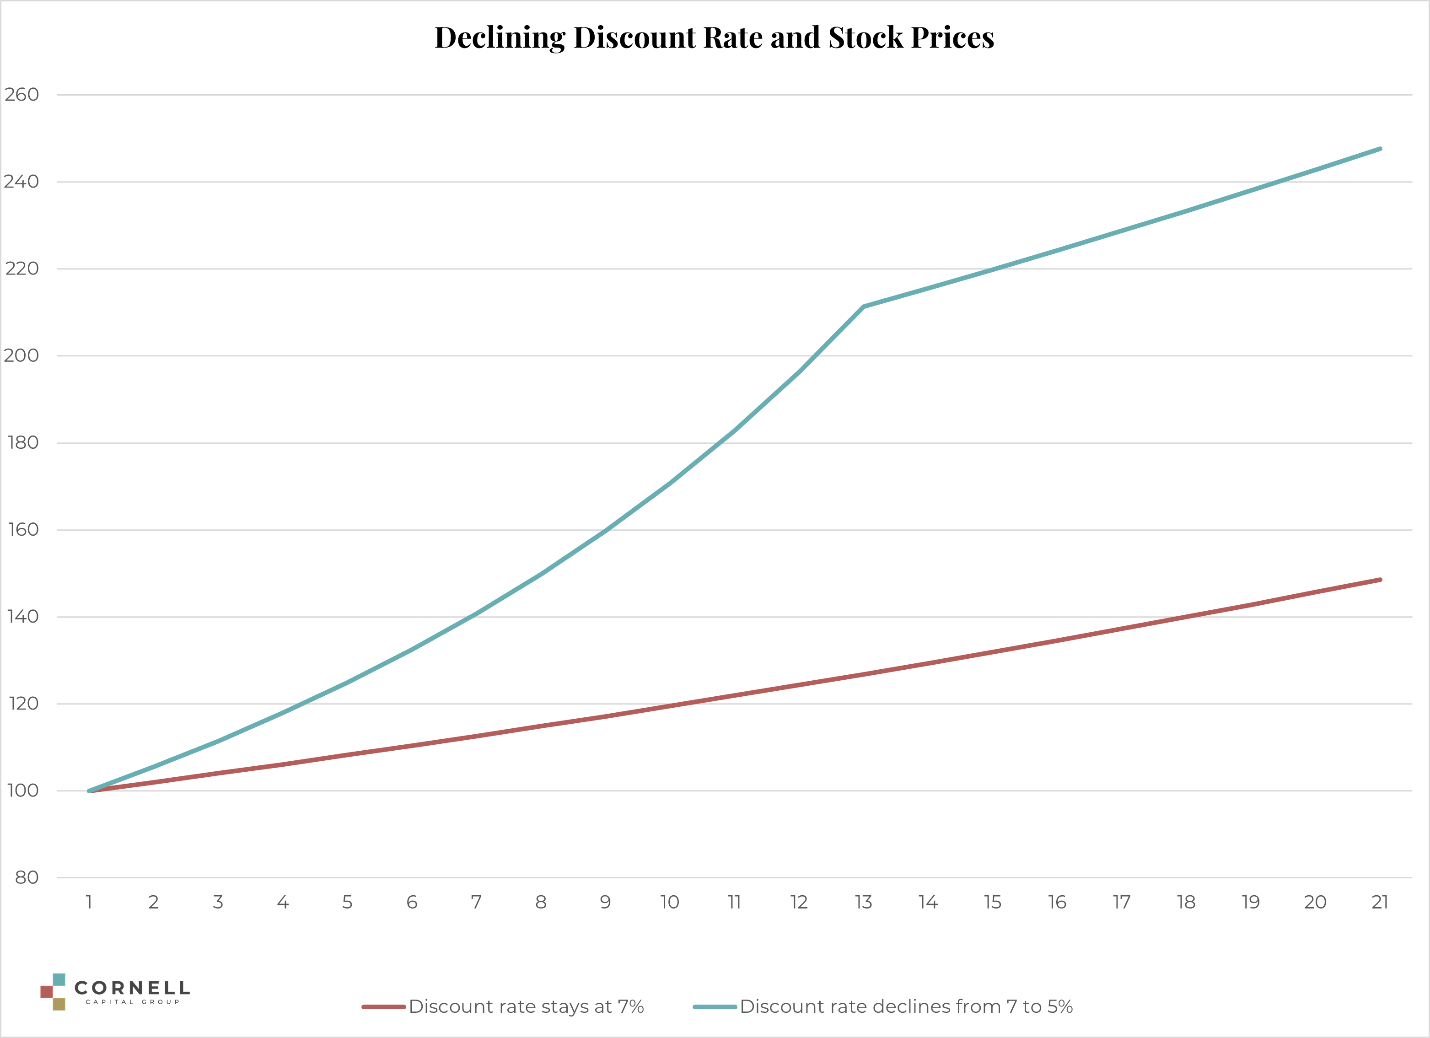
The reason for the high observed returns during the period of declining discount rates is a rising price for the hypothetical stock. The second chart below plots the price of the stock compared to what it would have been with no change in the discount rate.
Remember, in these calculations nothing changes except the discount rate. The chart shows the sharp rise in the stock price due to the falling discount rate.

There are two dark sides to a rise in the market associated with falling discount rates. The first is that once the drop is over, expected returns on stocks going forward are lower.
There is reason to believe this is where we are now.
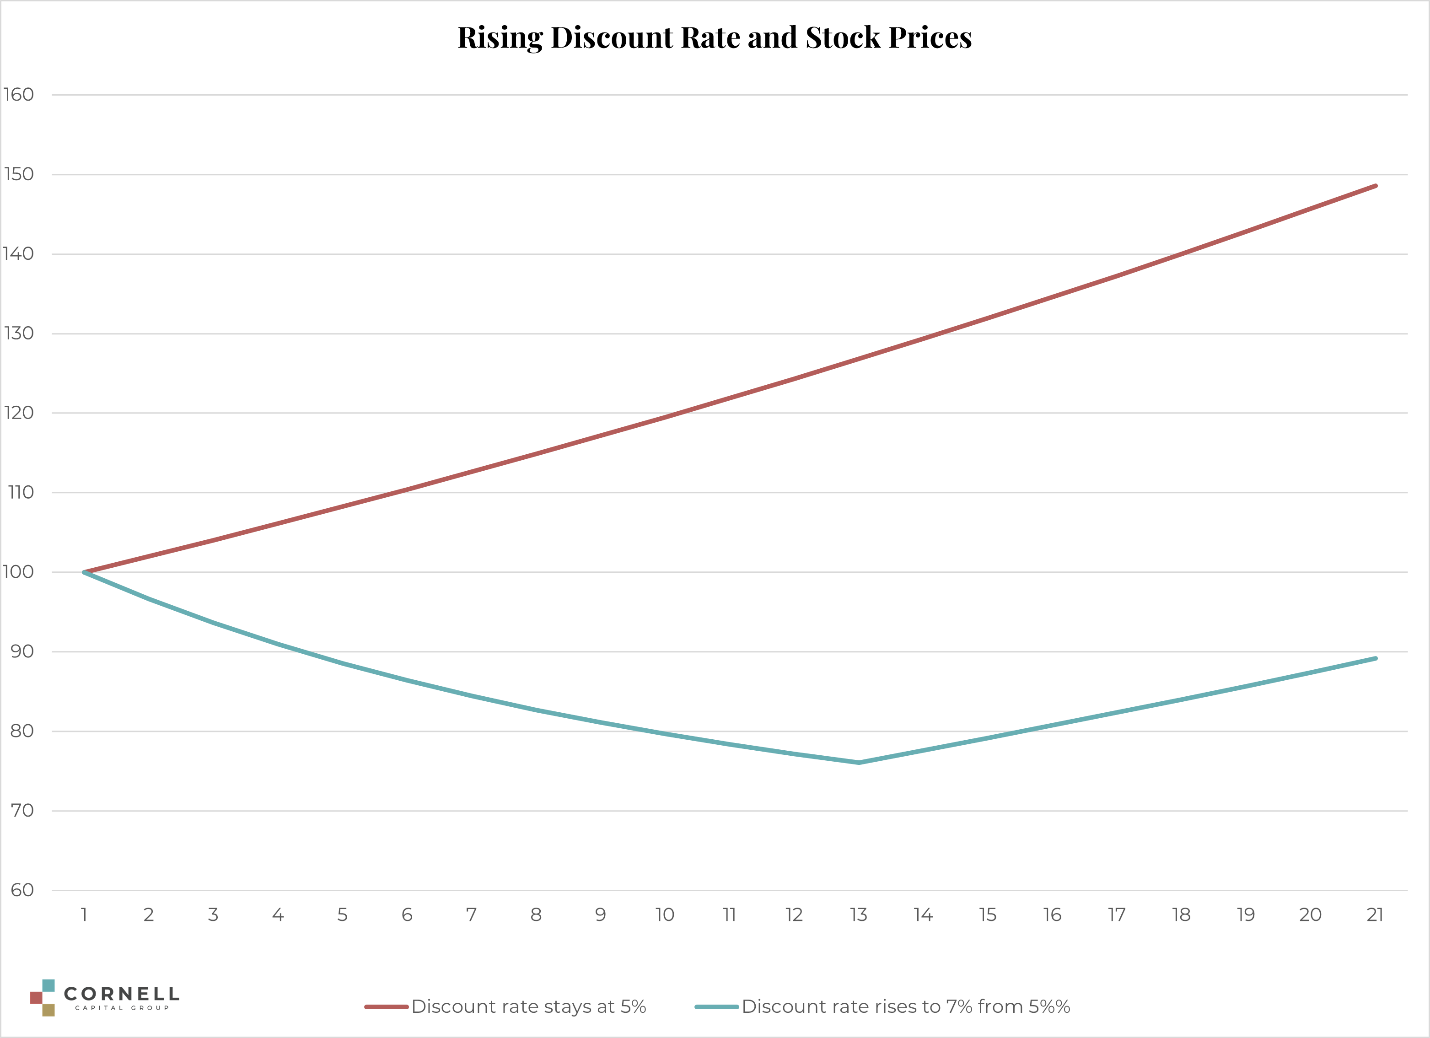
The second is that what goes down can rise again. If investor fears were to increase and discount rates were to rise, the process could reverse itself leading to a sharp drop in stock prices as shown in the final chart.

