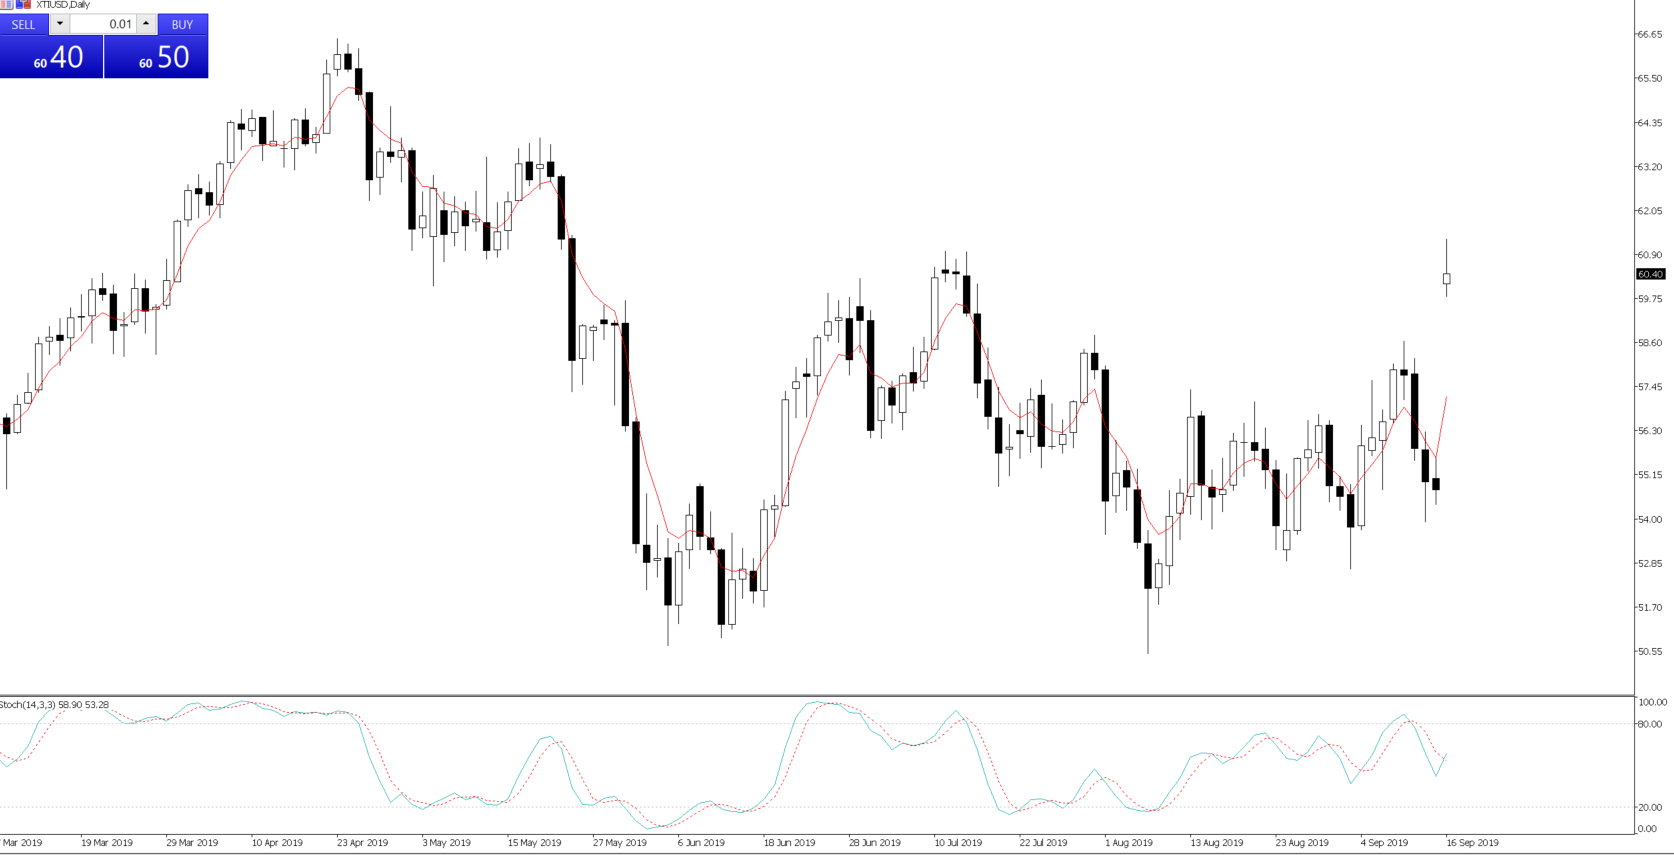
We start the week with oil front of mind, and our first take on how traders saw this was in the petro-currencies, with traders expressing this view with good buying in NOK, and to a lesser extent CAD and we should see buying in the RUB as the day rolls on. The moves in both Brent and WTI have been staggering, with Brent crude up nearly 20% at one stage, although price has settled back a touch as Trump has ordered the release of reserves.
Aside from good selling in TRY (Turkish lira) and ZAR, this is obviously not a good day if you are an oil importer, although we're not seeing too much of a move in the CNH. We usually assimilate higher crude moves with higher equity and broad support to risk, but obviously, the reasoning behind the move alters that way of thinking. The fact S&P 500 futures are 0.4% lower tells a story of a weaker open to Asia, but it's not so much an index play today, and clearly we think in terms of crude thematics - energy names are going to find a strong bid, as will defence names and any stock sensitive to higher oil such as airlines will find a strong drawdown on the open, while we should see inflation expectations push a touch higher in the fixed income world - there are still too many questions for oil traders in the short-term that may not get answers straight off the bat.
This isn’t just a question of who or even what actually caused the attacks, but some have questioned whether we will we see further attacks and Saudi infrastructure is vulnerable. In a world that saw signs last week that perhaps sanctions could be lifted on Iran, that argument now feels some way off, and John Bolton would be clearly be shaking his head. Obviously, depending on how long this goes on for, and how long it takes to get production fully back online, oil traders will be watching Saudi inventories, which could track to multi-year lows, while trading the ever ballooning Brent-Wti spread.
USDJPY is tracking -0.3% at 107.86, although buyers have come in post-Trump's comments. Moves in USDJPY and S&P 500 futures are interesting as it suggests we will see buying in US Treasury futures in early trade, and after last week’s wild scenes and sizeable unwind of an extended US Treasury long exposure, today’s tape could give us a solid insight into whether traders will use the early strength to offload further positioning, or whether this is the time to gingerly wade back in.
Consider USDJPY managed a 1.1% rally on the week, so buyers may support this weakness, but this was a function of the fixed income market having quite the move and a 34bp move higher in yield for US 10s is not something you’ll see too often. For the stats heads out there, this was a 3.5 sigma move and the fastest rate of change (ROC) since November 2016.

If we use 10s as our benchmark, we can see yields testing the two-standard deviation of the line of best fit (at 1.94%) of the bull trend drawn from the November high. So, if the Saudi oil story doesn’t manifest into a more protracted risk-off theme then we could see a further move into 1.94%, which also marries nicely with the July lows, so it is meaningful, especially with a stochastic momentum crossover on the weekly. I was looking to fade rallies into 108.75/109, so this also fits should we see bond sellers come back in today.
We can also see huge moves in the US rates market, with January fed funds future (yield) gaining 13bp, highlighting a market who still sees one more cut from the Fed after this week’s likely 25bp move, but that setting has been wildly altered. Aside from the incredibly overbought and over loved positioning in bonds, the news flow has warranted the re-positioning, and it has spilled over into other trading factors. That being, a strong unwind of short copper/long gold, low volatility/high beta, Russell 2000/S&P 500.
The better feel toward US-China trade has resonated, with some excitement about an interim trade resolution and China exempting some US ag products from the 25% list. Is this enough to see the Fed hold off this week? I’m unsure, and even after the move in rates the probability of a cut this week in 96.9%. We can add in good economic data, while in Europe there is much division within the ECBs ranks on how aggressive policy should be, and if we look at the European rates complex (here I look at EONIA 1y1y forwards) we can see 1-year forward expectations fell from -73bp to -57bp on the week.
That is supportive of the EUR, but on the daily chart, EURUSD has no idea what to think of this dynamic, with sellers happy to fade moves into 1.11. On the one hand, you see the ECB loath to cut rates any further, but keeping a lid on EUR buying, you have a bank committed to buying assets for an uncapped period. We should see this battle resolve itself one way or the other this week.
GBP was the superstar in G10 last week, with GBPJPY gaining 1.8%, with increasing hope we see a deal before 31 October. GBPUSD 2-month implied volatility collapsed from 16.12% to 8.93% in recent times, showing a certain calm has returned, but on Friday we are seeing GBP volatility buyers emerge ahead of a meeting between Boris Johnson and his EU comrades Juncker and Barnier. One to watch.
