In Friday’s Alert, we warned that gold and USD movement in the next few days might be a bit chaotic due to the geopolitical news that are currently hitting the markets. The new steps in the Brexit saga and the U.S.-China agreement continue to support intraday volatility. It’s relatively normal and once the dust settles a bit, the markets are likely to return to their previous trends. In case of the gold market, this means a move lower. The short-term decline might not last long before we see another corrective upswing, though.
The reasons are most clear in case of silver.
The Thorough Examination of Silver

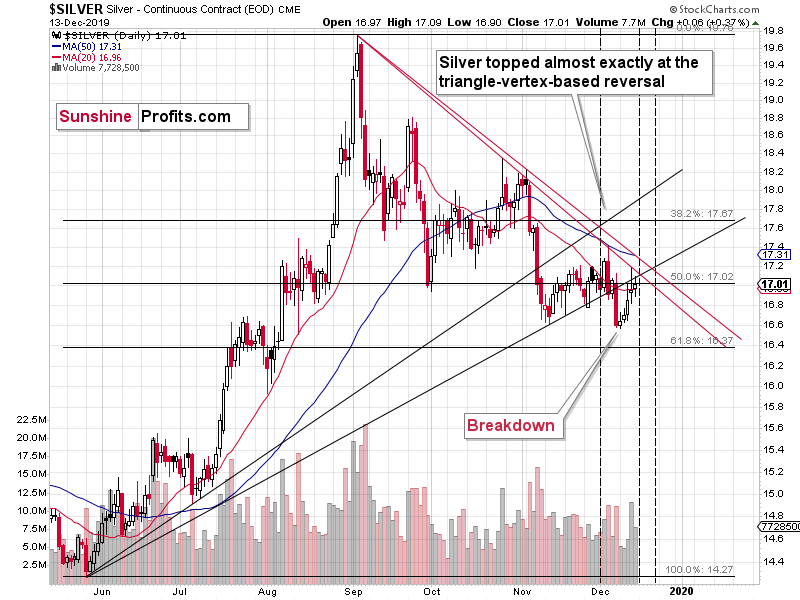
First of all, silver broke below the rising support line that’s based on 4 lows – the May low and three November lows. The white metal didn’t manage to break back above this line, which means that the decline is likely to continue.
Having said that, let’s focus on the three characteristics of a decline: its starting point, its ending point, and its shape.
The starting point is likely to take place early this week, perhaps even today. How do we know that it’s likely? Because of the triangle-vertex-based turning point that’s just around the corner. This technique proved to be useful many times in many parts of the precious metals market, also in silver when it reversed earlier this month. So, the next silver slide is likely just around the corner.
The ending point could be marked by the second triangle-vertex-based reversal happening right before Christmas that we see on the chart. These reversals could work on a near-to basis, so let’s say that the next week or the final week of the year are likely to include the next major reversal. That’s in tune with reversals on other charts, including gold’s long-term chart.
This doesn’t leave much time for the decline to take place, but… that’s where point number 3 comes in. The shape of the decline. Silver is known for (at least it should be known for) its fake breakouts and volatile declines. The latter means that seeing a quick decline shortly would not only not be odd – it would actually be in tune with the way silver declined previously. The September decline, the November decline, even the early-December decline – they all happened fast. Silver dropped decisively and quickly. As history tends to rhyme, it seems that we might see yet another show of silver’s bearish volatility shortly.
Do other parts of the precious metals market confirm this outlook? Let’s check.
The Short-Term Across PMs

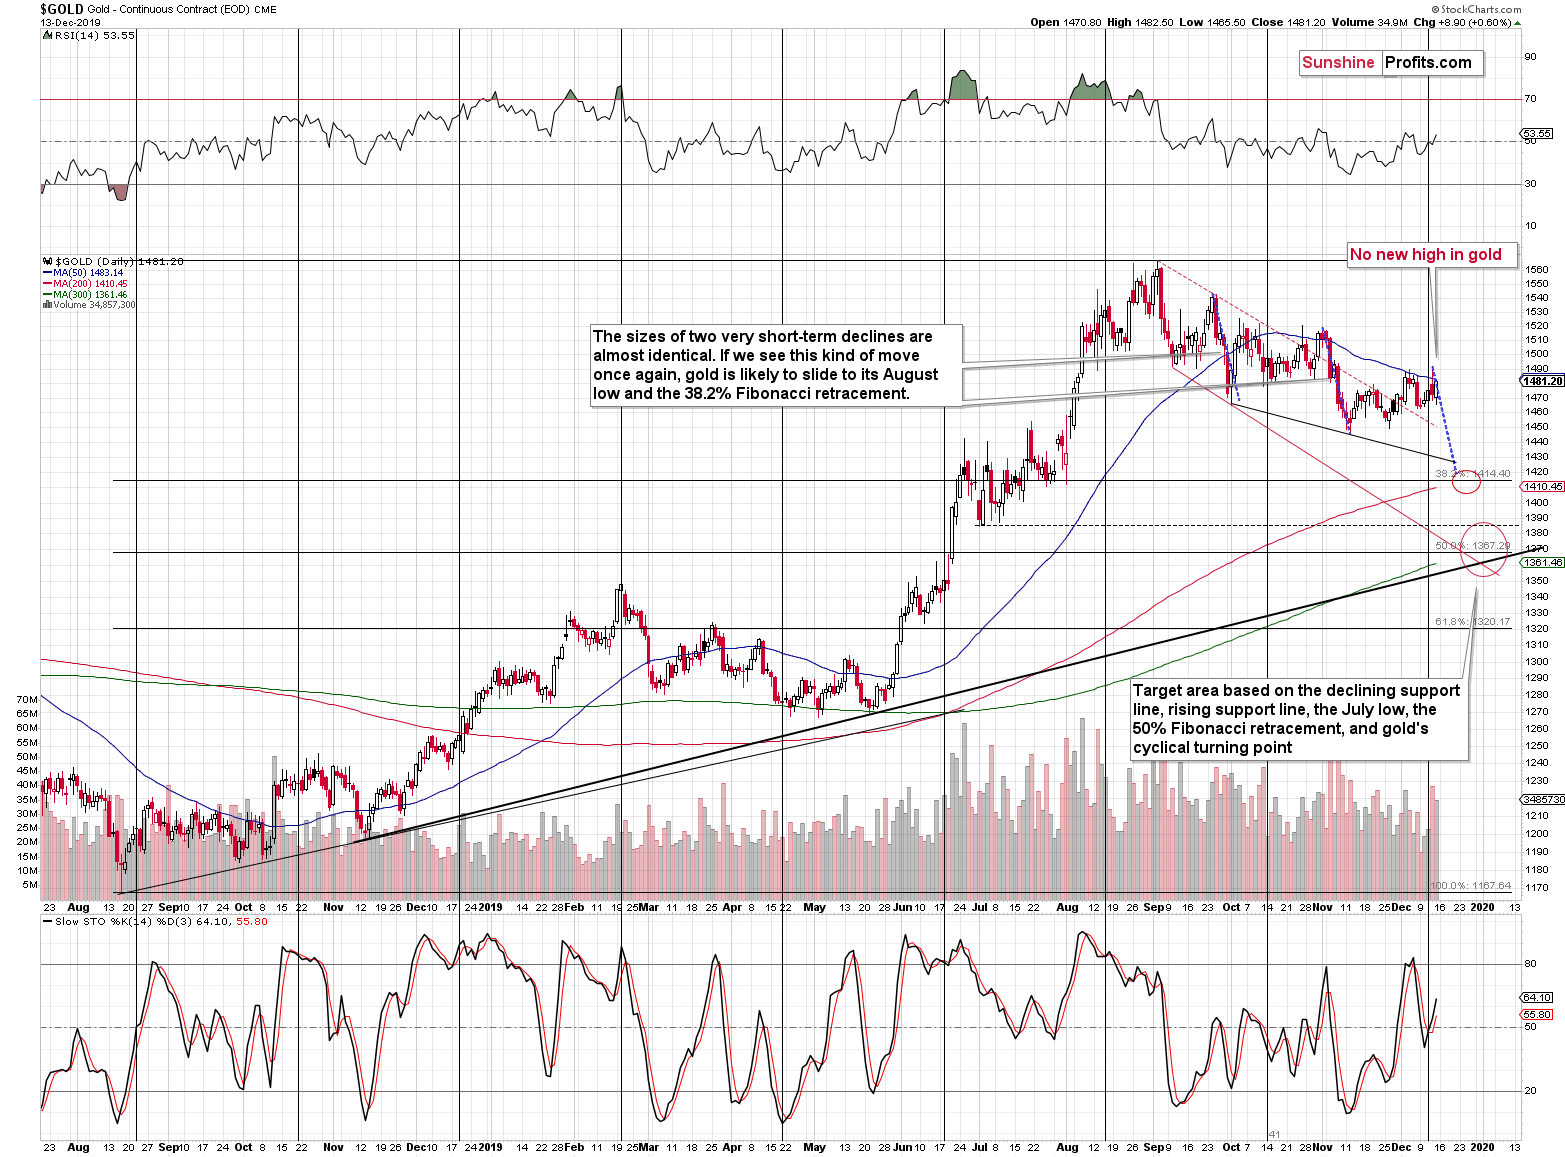
Gold hasn’t done anything to invalidate the previously bearish outlook. In terms of the closing prices, gold topped on December 3, which is when we took profits from our previous long position. It hasn’t closed higher ever since, even though it had a very good reason to. Namely, the USD Index declined profoundly since that time.
The context is always the king and this time, the action in the USD Index completely changes the implications of gold’s sideways trading. If the USDX was rallying and gold was refusing to decline, it would have been bullish. But that’s not what has been taking place. Gold has been reported to consistently refuse to soar despite sliding USD. That’s profoundly bearish for the short term.

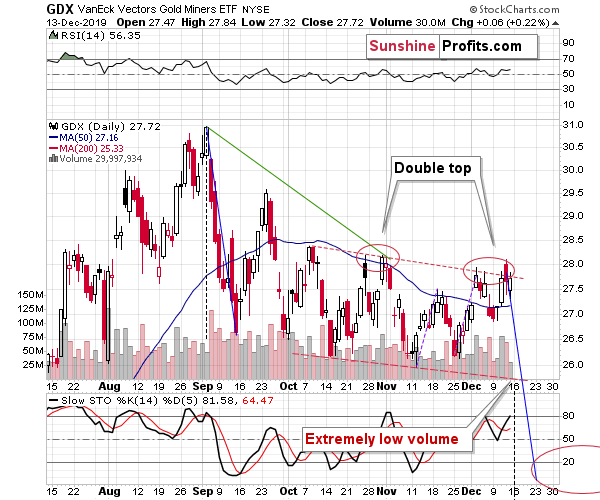
The mining stocks provide us with yet another confirmation.
This confirmation comes from the volume. It was extremely low. In general, whenever something rises on very low volume, it’s actually a bearish sign, because it shows that the market doesn’t really support this kind of move, and is rather forced to react in a given way. In case of mining stocks, it was probably a reaction to a sharp slide in the USD Index and a new high in the general stock market.
We haven’t seen volume this low in months. The last time when the GDX (NYSE:GDX) moved higher on a similarly low volume, was in late July. And what happened immediately thereafter? Miners plunged. Yes, they came back shortly thereafter, but the immediate reaction was very negative. This perfectly fits the implications of gold and silver charts.
